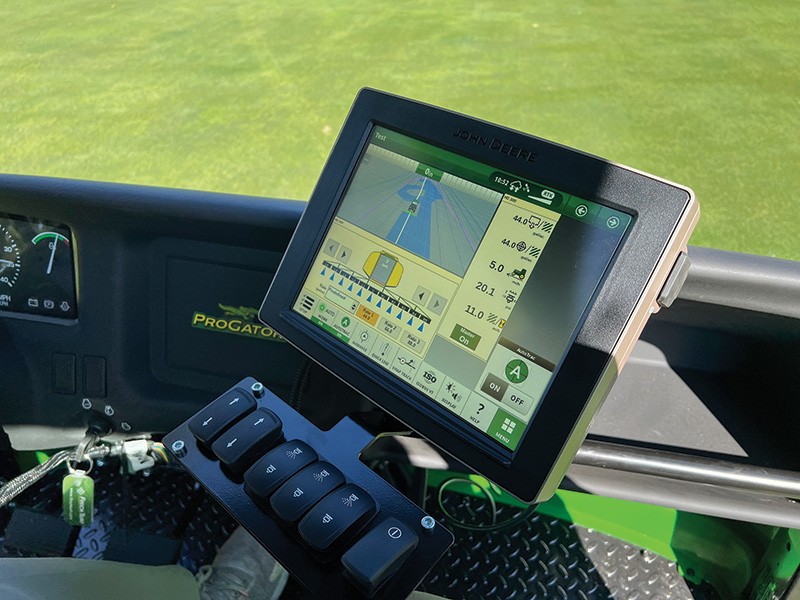
GPS sprayers are an example of how modern equipment can deliver an abundance of data points that can be used to fine-tune agronomic plans. Photos by Jim Pavonetti
Editor’s note: A version of this article appeared in the February/March 2023 issue of Tee to Green, the newsletter of the Metropolitan GCSA.
Modern-day superintendents have always evolved with changing technology and day-to-day maintenance standards. It feels like less than 10 years ago a Stimpmeter and a TDR moisture meter were the most modern tools superintendents were using.
Now it seems every month there is a new tool that superintendents can add to their data-collecting and maintenance programs.
As data collecting has become more and more prominent in greenkeeping, I have slowly watched and learned what it could do for my operation, either by saving labor, money or time, or making the golfing conditions better. I know lots of superintendents
who have not yet taken the data plunge, while others have been doing it for years. I thought an article from a data novice like me could help push others into the data-collection club. It doesn’t take much time, and it is definitely worth the
effort.
Similar to the use of analytics in professional baseball, all kinds of data are being collected and used to make daily decisions on the golf course. Whether it is to mow, or mow and roll, or roll only, or do nothing, data that is being collected can help
determine these things for us and keep playing conditions consistently within the established parameters.
“If you can’t measure it, you can’t manage it.”
This quote has frequently been attributed to management guru Peter Drucker. This is certainly true to a degree in our business. Superintendents are constantly being driven to improve, year after year. How can we do this without real data?
With data collection, superintendents can monitor trends in growth and compare that to inputs to better determine when applications should be made. This could be plant growth regulators or fertilizer, or both, to help produce the healthiest, best playing
surface possible.
For years, I had been a superintendent who was set in my ways, using experience to guide my programs. But little by little, I have been collecting more and more data to help me with daily decision-making and creating programs for more efficient turf practices.
Last season, I made the jump to begin to measure clipping yields off our greens every day of the mowing season, and I have never been more in tune with what was going on out on our putting surfaces — just from this one step.
This spurred me on to put this article together to hopefully encourage others into some of these more modern practices.
Our data-collecting programs have saved us labor and made us more efficient in how we distribute our resources, stretching our budget dollars more than ever before.
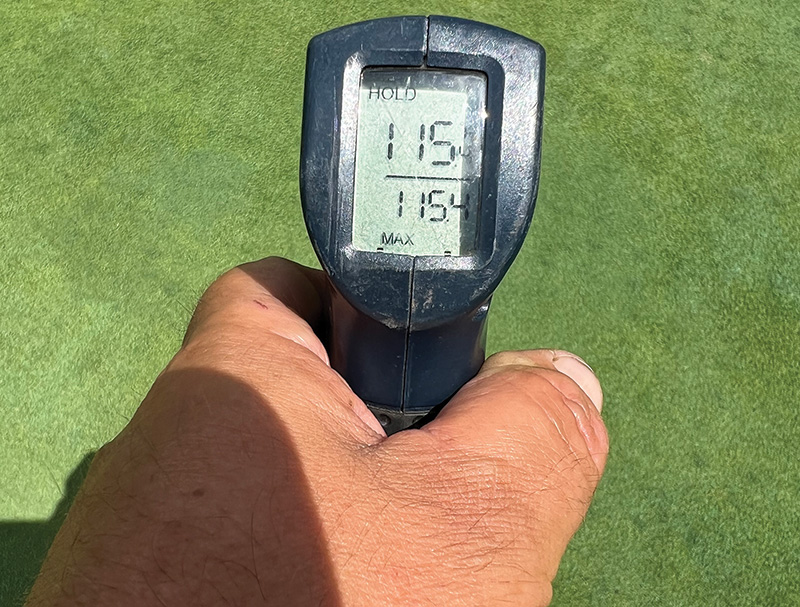
Surface-temperature guns are another simple, effective way to collect data on your course's turf condition.
Weather data
Never has there been so much weather data right at our fingertips. There is almost too much info — to the point that many of us do not know where to start. An on-site weather station is great for precise high and low temperatures so you can calculate
growing degree days for your specific site. Growing degree days help properly time crabgrass preventatives, annual bluegrass weevil controls and Poa annua seedhead controls, to name a few common ones. Evapotranspiration rates specifically for your
golf course can help make irrigation decisions.
There are multiple apps that can help, but one in particular — Turf Threat Tracker, or T3: https://t3.golf/ — has been developed specifically for golf courses by renowned meteorologists based on the user’s exact location and elevation
to help with forecasting the next 48 hours, including frost, dew formation, and even disease and pest activity.
If you don’t have an on-site weather station, Weather Underground has local weather stations you can access closest to your location. It’s not ideal, but it’s better than just guessing off a weather app that only gives an average of
information for a much larger area than our facilities, so the precision that we typically need is not there.
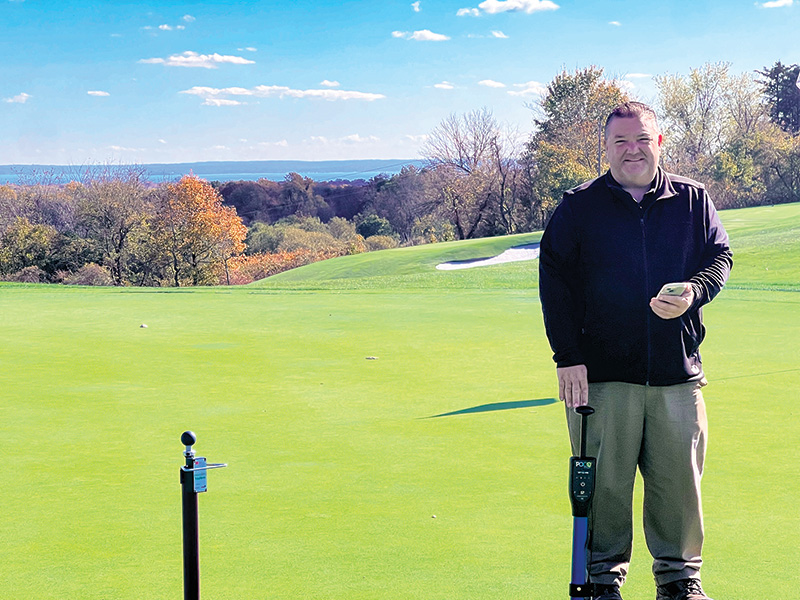
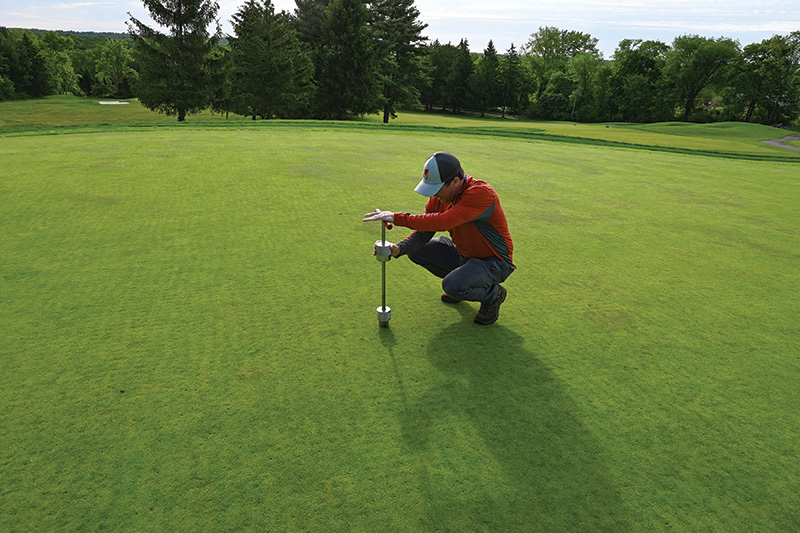
The author, Jim Pavonetti, CGCS, taking moisture and firmness readings at Fairview Country Club in Greenwich, Conn.
Nature data (phenological indicators)
Other data that can be useful for timing applications or forecasting potential problems is derived from tracking various indicators in nature.
Examples include the first robin sighting; forsythia blooming or forsythia half-green/half-gold; Catawba rhododendron blooming; Poa annua boot stage; bluebirds nesting; bluegills nesting; and other various plants blooming, just to name a few.
Pitfall traps and soap flushes can help superintendents determine if annual bluegrass weevils are active or reaching a predetermined threshold that calls for treatment.
Collecting and documenting this data over the course of several years will help you anticipate actions that need to be taken on your turf.
I find myself relying on a lot of this “nature” data more when we experience cold springs, when nothing seems to be happening when it should. Nature doesn’t lie, so having a few years of this data handy will help set up your season with
timely decisions.
Modern equipment data
It seems every year there are advances in turf equipment that make our jobs more efficient or in some cases can give us valuable data points for precise record-keeping. Topdressers now can come with an on-board computer that will dial in sand application
rates for us. GPS sprayers give all kinds of data on our applications and applicators’ performance.
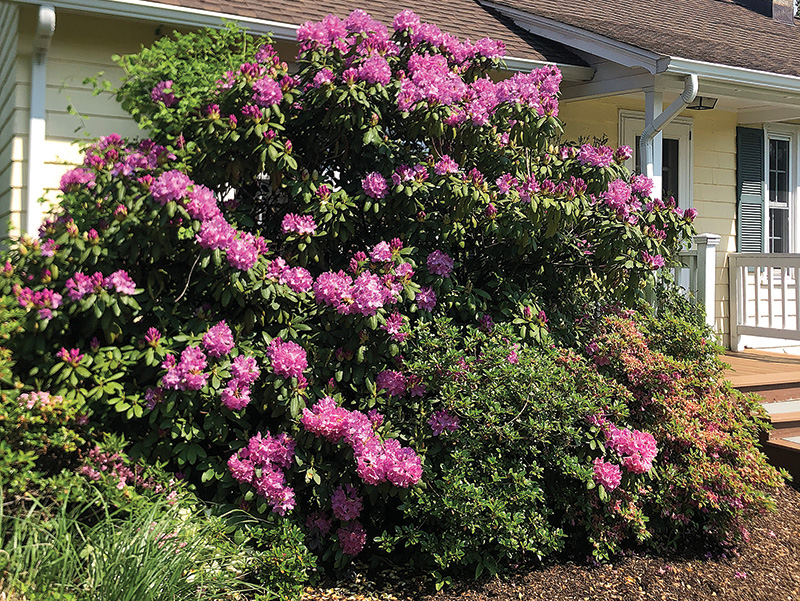
Phenological indicators, such as the blooming of the Catawba rhododendron to determine an insecticide application, can be useful data to track.
Irrigation, soil moisture, stress data
By now, most of us are regularly using time-domain reflectometry (TDR) moisture meters to help dial in irrigation applications. The POGO, which can map out the data via an app on a phone and computer, represents a leap forward in that type of technology.
Drones from companies like GreenSight will take it to the next level with daily flyovers covering entire golf courses, providing data from tee to green on all holes.
Sensors from TerraRad Tech can be placed on fairway mowers or other vehicles to map out all fairways, showing moisture content on all that acreage in an hour using microwave technology. Talk about some powerful data.
There is also an array of stationary soil moisture meters (from the likes of Toro, Spiio, Soil Scout). These can be helpful for moisture readings, but I find them even more useful for soil temperatures, allowing me to see the average temps to perfectly
time certain chemical applications. These include initial preventative applications for fairy ring, summer patch and take-all patch.
Not as commonly used, but readily available and affordable, are the forward-looking infrared attachments for smartphones. FLIR cameras provide thermal images which highlight areas of stress, especially drought or heat stress. The images will show the
stress before the turf visually does, so this can be a way to mitigate or prevent the turf from being overly stressed altogether. A quick syringing or moving a portable fan to one of these areas could save a lot of stress on the turf and us. Even
simpler yet, a surface-temperature gun that can be purchased at any hardware store is a quick and handy way to look at surface temperatures on a hot day. For us, when we see surface temperatures start to exceed 110 degrees F (43 C), we cool the greens
with hoses.
The normalized difference vegetation index (NDVI) meter from Spectrum will provide quality ratings that can help show stress, giving the superintendent a chance to react to stress before the turf begins to decline. It’s just another tool that can
be used to run our own trials on new products or closely monitor turf conditions as the summer wears on.
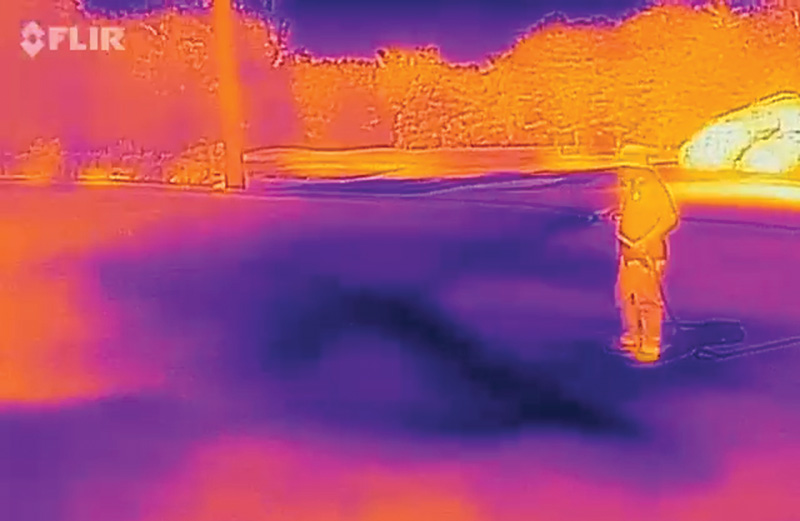
FLIR imagery can show areas of stressed turf before visible signs appear, giving us data to make a quick decision to mitigate the stress.
Putting surface performance data
Aside from moisture readings, there are several data points that can give us information about how our putting surfaces are performing and how they react to different weather conditions.
Speed: Obviously, the most talked about data point among our players is usually green speed, which is most commonly measured by a USGA Stimpmeter. In the last 10 years, the USGA has released a Stimpmeter with an alternate spot to place the ball so that
undulated greens can be measured fairly accurately but in half the distance. Doubling that measurement gives a nearly accurate speed for that particular green.
During the shoulder seasons, I will ride the course and measure speeds before the staff begins the day. Even though this measurement is in the dew, it can give me a reasonable idea whether I should skip the mow or roll for the day. I have a target daily
speed, so if the measurement in the dew is close to my target already, I know there is no need to further beat my turf up with unnecessary maintenance and I can direct my limited labor elsewhere.
Keeping daily track of green speeds allows me to adjust mowing heights or change roller configurations to meet my target green-speed range. Tracking the height of cut, which front roller we are using, walking versus riding mowers, single cut versus double
cut, how often we roll or double roll, etc., are all useful data points that will help make maintenance decisions easier in the future.
Firmness: I will be the first to admit that when the USGA and Spectrum first released the Firm Meter, I quickly purchased one and then wondered what I would do with this “useless” information. It wasn’t until I began
to measure firmness daily that I began to see the trends and relationships between moisture and firmness. Now it is another valued data point that lets me know where the greens stand in terms of playability. I have a measurement range of where I like
the greens to be, where ball marks are not too bad (almost invisible or nonexistent), but not so firm so that my general membership can’t hold their shots on the greens. After studying this for a few seasons, I realized that I could control
firmness to some degree with moisture.
Smoothness: I watch the balls as they roll off the Stimpmeter to look for wobble. I line up the logo on the ball so that it allows me to see how the ball tracks across the surface. The USGA has developed a device called a GS3 to allow
superintendents to begin to measure and track green speed, firmness, smoothness (up and down movement) and trueness (side to side movement) of the putting surfaces. This will add another layer to our data.
Quality of cut: To monitor quality of cut, we frequently will use a magnifying prism. This data will tell my equipment manager when it is time to sharpen or back-lap cutting units.
Clipping yield: For several years, I have watched our Canadian friends measuring clippings off their greens and wondered what that information would do for me. Last season, I decided to start measuring the total amount from all the greens
each day. I purchased basins that fit in the bed of our utility carts and instructed the staff to dump all their clippings in the basins and leave the basins with their clippings at the shop in a designated area. Then I, or one of my assistants, would
pour the clippings in empty link packs with the tops cut off. The link packs have volume measurements already marked, so this seemed like a reasonable way to start.
Measuring the clipping yield has shown us when nitrogen is getting mineralized and released during stretches of weather that excessively warm the soil temperatures. When we see the clipping yields rise, we know that we can hold off on any spoon-feeding,
since the higher yields are indicating nitrogen being rapidly released to the turf. This not only saves money by avoiding unnecessary nitrogen applications but also can avoid the problems that come with over-fertilizing the turf. Plant growth
regulators could be increased at this time as well.
Although I see others measure clippings from individual greens, we have not gone that far yet. That could be the next step. Our terrain and elevation changes at Fairview Country Club create diverse microclimates for us to manage, so seeing clipping
yields from individual greens could make sense for us.
Soil testing, loss-on-ignition testing and ISTRC testing give superintendents numerous data points to determine fertilizer requirements, topdressing requirements, additional aeration, etc. If done over multiple years, the data will show upward or downward trends that will justify and illustrate the need for altering certain agronomic programs.
Cultural practices
Collecting data for cultural practices such as aeration, verticutting and topdressing can be useful in determining how much is needed and tracking how much has been done.
Loss-on-ignition testing will tell you how much organic matter is present in what you are testing. These tests are inexpensive, so we have been testing all our greens for a few years. As seasons go by and we have additional data from these tests,
we will be able to see if some greens require more “catch-up” aeration than others. Wouldn’t it be nice to know when you get to a particular green that you can have your operator move the selector to a closer spacing to punch
more holes in a green that contains more organic matter than the others, or switch the tines out for a larger diameter?
International Sports Turf Research Center testing will also give you organic matter levels as well as percolation rates. Possessing this data can help make decisions on deeper aeration methods and the amount of aeration that needs to be done to get
the greens in a desired test result range.
Organizing the data
Once you dive into data collection, there has to be a plan on how to organize the data so that it is easy to read and see what is going on with your turf. There are many apps to help organize this for you.
Greenkeeper, TurfPro, Playbooks and Deacon from the USGA are becoming popular. For my operation, I have built a spreadsheet using Excel to organize my data. The key is to have a system that is easy to update and manage so that it does not become a
burden. It’s a great way to get assistants, interns and top crew members involved with agronomic program management.
For additional information, below are two links from the USGA Green Section that cover data collection:
A Quick-Start Guide to Putting Green Data Collection
Addressing Common Concerns About Putting Green Data Collection
In summary
If you have not dived into data collecting yet for your operation, you are probably just not realizing that you already have to some degree.
For those wanting to dive in and begin to get serious about using data to make more precise agronomic decisions, I suggest starting small and making it as manageable as possible and adding to it in increments. You will quickly see the value of having
a dashboard of data that will enable you to save money, labor, materials and time in your operation.
Jim Pavonetti, CGCS, is the director of golf and grounds maintenance at Fairview Country Club in Greenwich, Conn. He is a 28-year GCSAA member.