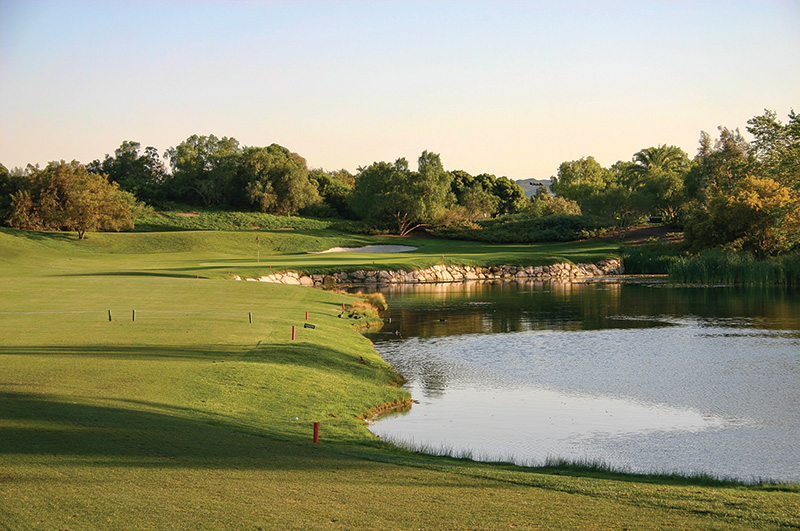
Golf facilities include areas and structures that may have varying amounts of influence on environmental benefits and risk, such as native areas, aquatic features, turfgrass, parking lots, buildings, etc. Photo courtesy of J. Bryan Unruh
The U.S. golf industry’s total economic impact in 2022 was $101.7 billion, with total wage income measuring $80 billion for approximately 1.65 million U.S. jobs within the golf industry (9). Comparatively, the total value-added contribution of the
“green industry” (landscape, florists, nurseries, etc.) in 2018 to the gross domestic product was $190.98 billion, including labor income contributions of $121.55 billion, from direct employment of 1.6 million full-time and part-time individuals
(6). The economic impact of the golf industry is derived, in part, from the large land area and assets needed to accommodate the game’s needs.
Golf facilities comprise a variety of areas and structures that may have varying amounts of influence on environmental benefits and risk, such as native areas, aquatic features, turfgrass, parking lots, buildings, etc. In addition, golf facilities require
energy to operate, which includes everything from fuel for machines to electricity for office equipment. Human behavior and facility design that govern energy use may result in potential environmental risk as well as mitigation of those risks. Managed
vegetated sites often necessitate inputs of water, nutrients and pesticides, also resulting in potential environmental impact.
To enhance best management practices (BMPs), to quantify environmental benefits, and to identify areas where resource conservation goals can be set, it is critical that land-use and energy practices of golf facilities are periodically measured. The first
known assessment of U.S. golf facility land use was conducted in 2006 as part of the Golf Course Environmental Profile (GCEP) survey series (8). Golf facility land use was reassessed in 2015 (2). Similarly, the inaugural assessment of energy use on
U.S. golf facilities was conducted in 2008 (7) and then reassessed in 2015 (3). The land-use and energy-practices surveys play an integral role in education and advocacy. To further document the trends in land use and energy practices on U.S. golf
facilities, a third iteration of the GCEP survey was conducted in 2021 with the objective to document changes in land use and energy practices since the first baseline surveys were conducted.
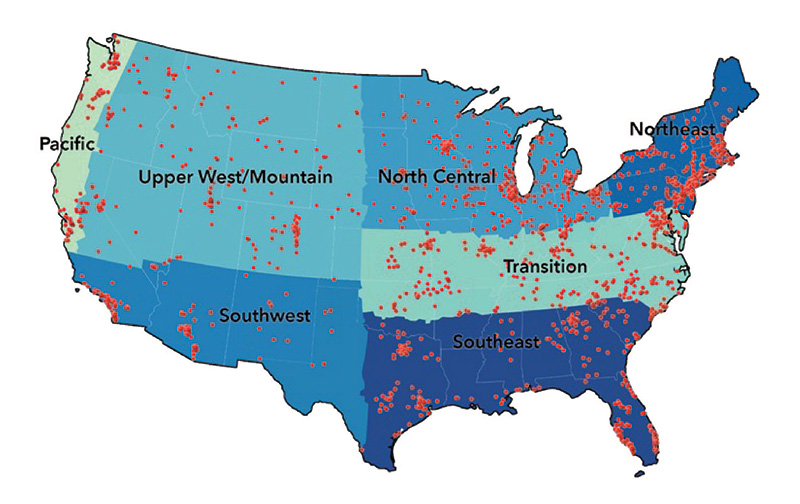
Figure 1. Geographic distribution of respondents to GCSAA’s surveys and the designated agronomic regions.
Methodology
An electronic survey instrument was developed with questions that were identical to those used in the prior two surveys. A survey link was emailed to golf facilities using the mailing lists of the National Golf Foundation and GCSAA, which resulted in
the link being sent to 13,938 golf facilities. A golf facility was defined as a business where golf could be played on one or more golf courses. The survey was opened on Sept. 1, 2022, and closed on Oct. 17, 2022. Survey respondents remained anonymous,
and 2021 data were merged with data from the same surveys conducted in 2005 and 2015 (land use) and 2008 and 2015 (energy use) to allow for a measurement of change over time. Responses were received from 1,861 facilities, which represented 13.3% of
the known total of U.S. golf facilities.
Respondents were stratified by agronomic region (Figure 1). To provide a valid representation of U.S. golf courses, data were weighted by categorizing responses into one of 35 categories depending upon the facility type (public or private), number of
holes (9, 18 or 27-plus), and public green fee (less than $55 or greater than/equal to $55 per round). The weights were calculated by determining the proportion of each group within the total survey response. Median and percentage values were determined
using only 18-hole facilities except where facility types were compared by holes. Median separations were performed using accepted statistical procedures (13). Projected values were based on 18-hole equivalents, which were calculated by assigning
9-, 18- and 27-hole facilities an 18-hole-equivalent value of 0.5, 1.0 and 1.5, respectively. Projected values were calculated by multiplying the 18-hole facility average acres by the respective 18-hole-equivalent value.
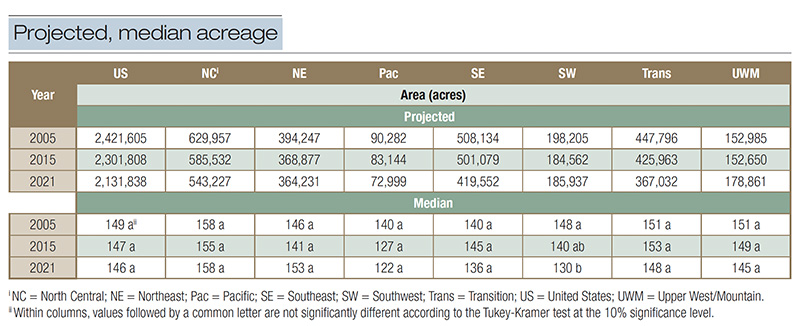
Table 1. Total projected and median acreage of US golf facilities in 2005, 2015 and 2021.
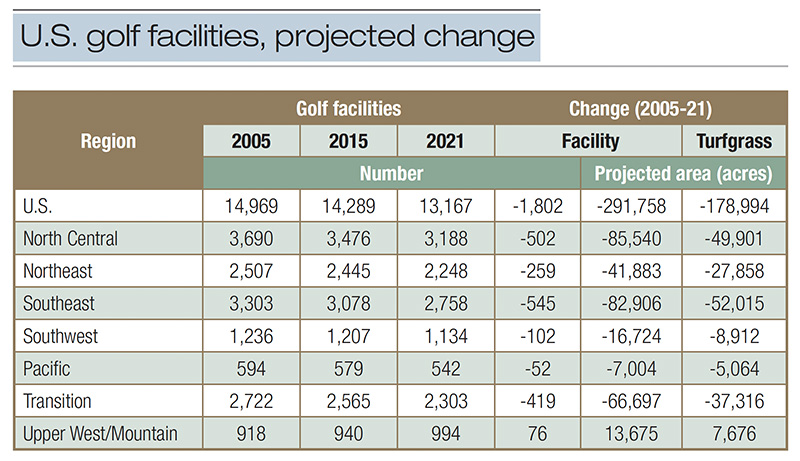
Table 2. Number of U.S. golf facilities in 2005, 2015 and 2021 by region and the projected change in facility and turfgrass acreage between 2005 and 2021.
Results
Facility acres/turfgrass acres
Facility acres of U.S. golf facilities continue to decline and were 12% lower in 2021 (2.1 million) than in 2005 (2.4 million) (Table 1). The Upper West/Mountain region increased facility acreage by 17%, whereas all other regions reported reductions in
total acres ranging from 6% in the Southwest to 19% in the Pacific. Median facility size (146 acres) did not change between 2005 and 2021 nationally or within regions except within the Southwest region, which reported a 12% reduction in facility size
from 148 acres in 2005 to 130 acres in 2021.
The number of facilities in the U.S. and within each region, except the Upper West/Mountain, decreased between 8.3% (Southwest) and 16.5% (Southeast), with a total reduction of 1,802 facilities in the U.S. (Table 2). The Upper West/Mountain region was
the only region of the U.S. that reported an increase in the number of facilities, with an increase of 76 (8.3%) since 2005. Since the projected U.S. total facility acres declined, but the U.S. median facility acres did not, one may surmise that the
reduction in projected total acres is attributed to facility closures.
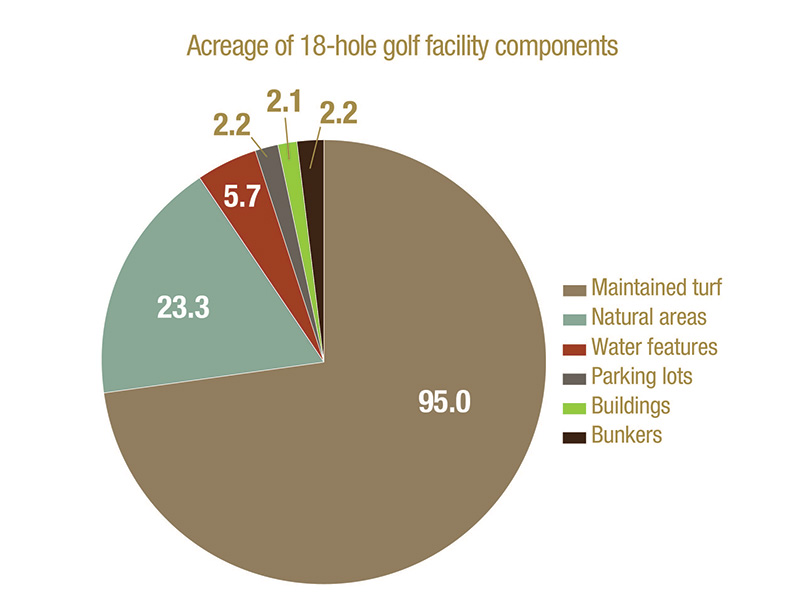
Figure 2. Median acres of 18-hole US golf facilities by facility features in 2021.
Since the inception of the GCEP land-use surveys, total facility acreage is delineated into the various assets at a golf facility, including maintained turfgrass acreage, natural areas, water features, buildings, etc. In 2021, the allocation of land-use
acreage of an 18-hole golf facility was (Figures 2 and 3):
• 95 acres of maintained turfgrass.
• 49 acres of roughs.
• 27.1 acres of fairways.
• 5.9 acres of practice areas.
• 3.3 acres of greens.
• 3.1 acres of tees.
• 1.7 acres of clubhouse grounds.
• 0.8 acres of turfgrass nursery.
• 23.3 acres of natural areas.
• 5.7 acres of water features.
• 2.2 acres of parking lots.
• 2.2 acres of bunkers.
• 2.1 acres of building.
Median maintained turfgrass acres was greater on 27-plus-hole facilities than on 9- and 18-hole facilities in 2005, 2015 and 2021 for each course feature except nurseries (Table 3). As golf facilities increase the number of holes, the number of maintained
turfgrass acres must also increase. Thus, the greater maintained turfgrass acres at larger facilities was expected. However, the increase was not concomitant to the increase in holes and varied according to course feature. For example, in 2021, maintained
rough acres were 2.9- and 5.3-fold greater on 18- and 27-plus-hole facilities, respectively, than on 9-hole facilities.
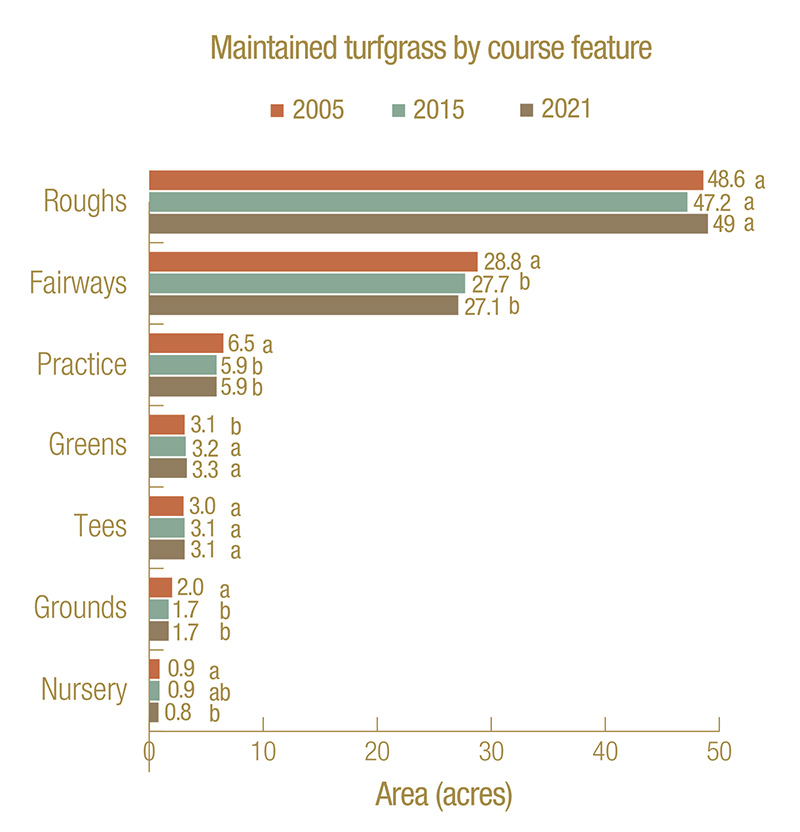
Figure 3. Median acres of maintained turfgrass by turfgrass feature on 18-hole U.S. golf facilities in 2005, 2015 and 2021.
Median total maintained turfgrass acres declined on 9- and 18-hole facilities between 2005 and 2021. However, median maintained turfgrass acres increased on 27-plus-hole facilities from 142.7 to 167.5 between 2005 and 2021, respectively. The increase
on 27-plus-hole facilities occurred because of increased acres of greens, tees, fairways and roughs, with the largest contribution of 17.1 acres occurring in roughs. The decrease of turfgrass acres on 9-hole and 18-hole facilities occurred on fairways
and practice, nursery and grounds sites.
Nationally, median acres of greens increased from 2005 to 2021 from 3.1 to 3.3 acres (Table 4). Median acres of greens also increased by 0.3, 0.4 and 0.4 acres in the North Central, Northeast and Pacific regions, respectively. Although putting greens
commonly account for less than 4% of the total maintained turfgrass acres on U.S. golf facilities, putting green management is typically more intensive and requires greater resources per acre than areas such as fairways and roughs. To this end, the
increase in putting green acres may disproportionally influence a golf facility’s energy requirements. Median acres of tees did not change nationally or within any region between 2005 and 2021. In 2021, median acreage of fairways was 27.1, which
was a decline of 5.9% nationally from 2005 to 2021. Median fairway acres also declined within each region except the Northeast, Pacific and Southwest, which reported no change between 2005 and 2021. The change in median acres of roughs between 2005
and 2021 varied according to regions, with no change reported nationally. The Southeast reported a 10% increase in median rough acres between 2005 and 2021, whereas the Southwest reported an 18.7% decrease. The decline in maintained turfgrass acres
in the Southwest may be a result of increased cost or reduced access to irrigation water. Shaddox et al. (2022) reported water use in the Southwest exceeded that reported in other U.S. regions in large part due to the high heat and low precipitation
common to the region (10). Thus, golf facilities faced with increased cost of water and/or reduced access to water may be electing to remove turfgrass acres to remain operational and within budget. More research in this area would provide greater
confidence in this postulate.
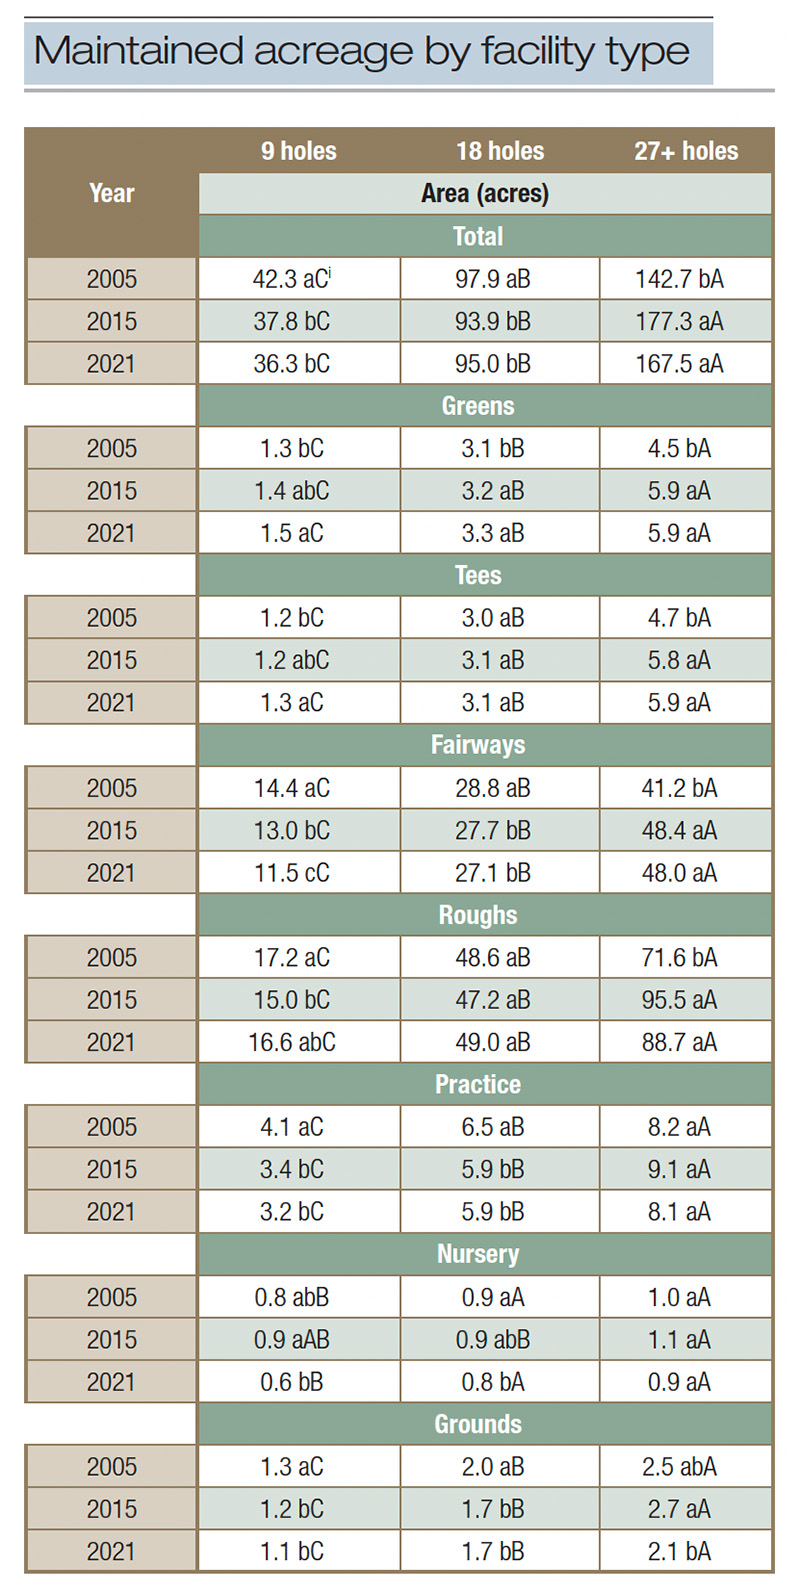
Table 3. Median maintained turfgrass acreage for 9-, 18- and 27-plus-hole U.S. golf facilities in 2005, 2015 and 2021. (i Within columns, values followed by a common lowercase letter are not significantly different according to the Tukey-Kramer test at the 10% significance level. Within rows, values followed by a common uppercase letter are not significantly different according to the Tukey-Kramer test at the 10% significance level.)
Water feature acreage
In 2021, the projected area of water features for U.S. golf facilities was 141,746 acres, accounting for 6.6% of the total golf facility acreage (Table 5). This reflects a 24% total reduction and was reported across all water features (open, wetlands,
streams/rivers, drainage waterways and irrigation canals) (Table 6).
Each region reported a reduction in water feature acreage except the Upper West/Mountain region, which had a 19% increase since 2005 to 11,202 acres. This increase occurred primarily as open water and wetland features.
An 18-hole golf facility had a median 5.7 acres of water features, or 4% of the facility’s acreage. The greatest median acreage of water features was in the Southeast region (10.2 acres), which was nearly double the national median.
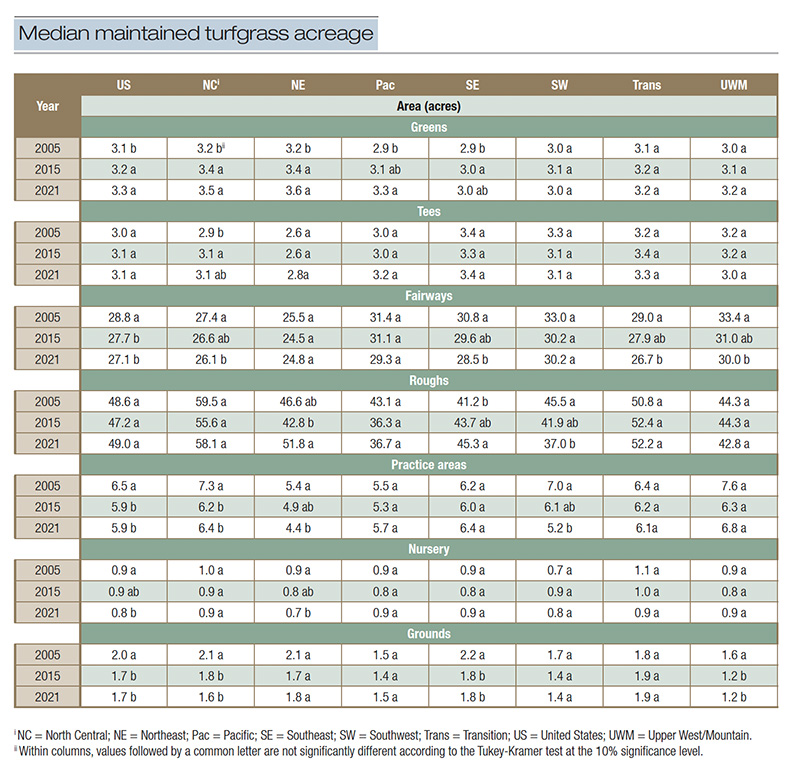
Table 4. Median maintained turfgrass acreage of U.S. golf facilities in 2005, 2015 and 2021.
Natural/native/unmowed acreage
In 2021, an 18-hole golf facility had a median 23.3 acres of natural areas, which accounted for 18% of the total facility acreage. Nationally, the projected acreage of natural areas on U.S. golf facilities was 549,518 acres, with the greatest acreage
(25%) reported in the North Central region, and the least acreage (3%) reported in the Pacific region. All regions increased natural area acreage except for the Pacific (11% reduction) and the Southeast, which remained unchanged since 2005. Golf facilities
in the Southeast had the fewest natural acres (15.2 acres), and the Northeast had the greatest reported acreage (31 acres), but it did not differ from the other regions except the Southeast.
The largest component of natural areas was forests, which accounted for 41% (Table 7). The acreage of native/undisturbed grasslands has nearly doubled since 2005 and was the second largest component of natural areas (27%) in 2021. A notable reduction
in buffer strip acreage (31%) and riparian zones (43%) was reported.
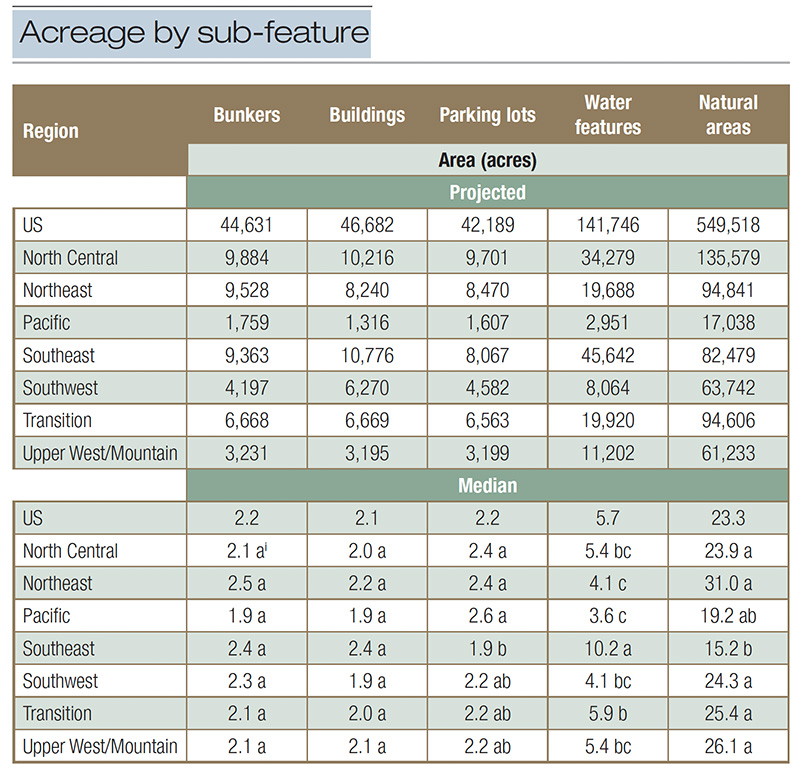
Table 5. Projected and median acreage of U.S. golf facility sub-features in 2021. (i Within columns, values followed by a common letter are not significantly different according to the Tukey-Kramer test at the 10% significance level.)
Impervious surfaces and other features
Buildings — In 2021, an 18-hole golf facility had a median 2.1 acres of buildings — down 42% from 2005 (Table 8). Differences in building acreage in 2021 did not differ across the regions, but all regions reduced their building footprint
ranging from 32% (Upper West/Mountain) to 49% (Transition) since 2005. Buildings accounted for 1.6% of the total facility acreage in 2021 and totaled 46,682 acres.
Parking lots — In 2021, the projected acreage of parking lots on U.S. golf facilities was 42,189, which accounted for 1.9% of the total golf facility acreage (Table 5). Across each region except the Pacific, parking lot acreage was one-third
less than reported in 2005.
Bunkers — In 2021, an 18-hole golf facility had a median 2.2 acres of bunkers, which accounted for 1.6% of the total facility acreage accounting for 44,631 acres (Table 5).
Cart paths — In 2021, the projected area of cart paths on U.S. golf facilities was 34,565 acres, which accounted for 1.6% of the total golf facility acreage and represented a 22% reduction from 2005 to 2021 (Table 9). All regions except
the Upper West/Mountain reported fewer cart path acres, with reductions ranging from 9% (Northeast) to 42% (Southwest). The Upper West/Mountain reported 16% greater cart path acres, which mirrors the increased facility acreage in that region. This
may be attributed to the region’s increase in the number of facilities.
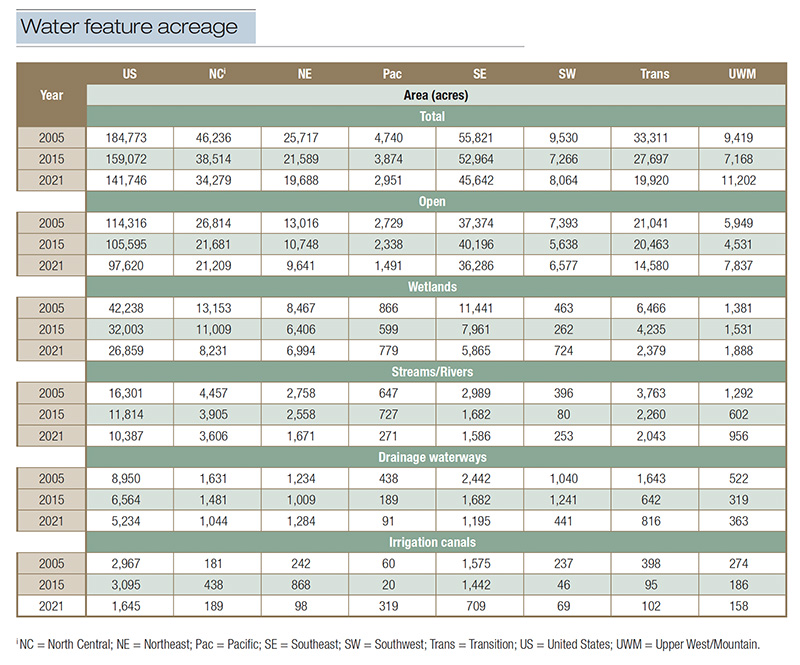
Table 6. Projected acres of water features on U.S. golf facilities in 2005, 2015, and 2021.
The median 2.1 acres of cart paths on an 18-hole golf course equated to a 24% increase from 2005 to 2021. Because the median cart path acreage increased and the projected cart path acreage decreased, the cause of the projected cart path acreage reduction
was course closures from 2005 to 2021.
The median length of cart paths varied greatly depending on region, with the longest cart paths reported in the Transition at 23,357 feet and the shortest reported in Northeast at 11,566 feet. Nationally, the median width of cart paths did not change
and remains at 6.8 feet (Table 9).
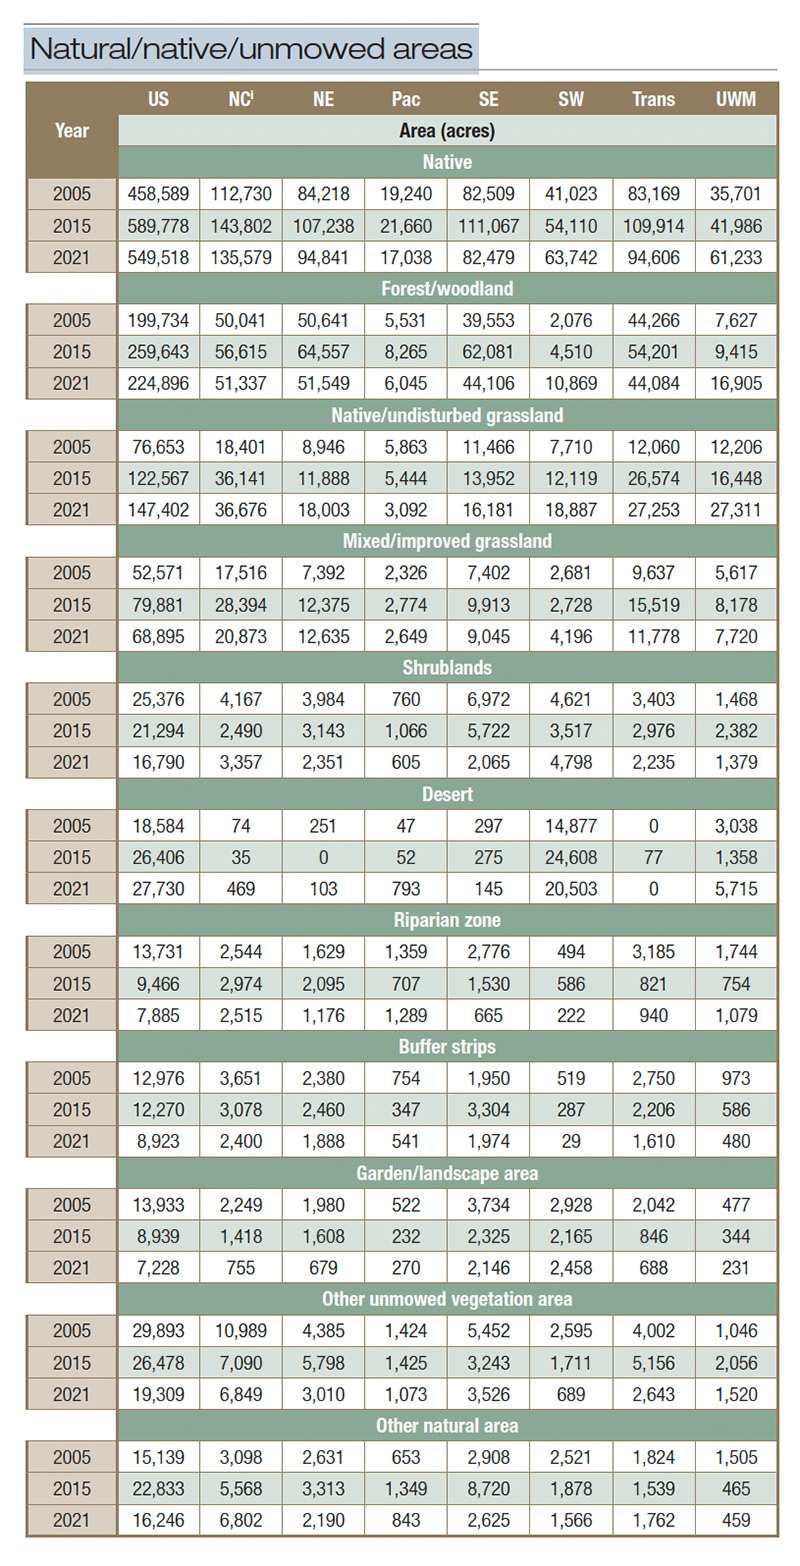
Table 7. Projected acres of natural/native/unmowed areas on U.S. golf facilities in 2005, 2015 and 2021. (i NC = North Central; NE = Northeast; Pac = Pacific; SE = Southeast; SW = Southwest; Trans = Transition; US = United States; UWM = Upper West/Mountain.)
Environmental practices
Participation in state BMP programs has increased substantially since 2015. When first asked about state BMP programs in 2015, only approximately 5% indicated their participation. In 2021, approximately one-third of U.S. golf facilities are participating
in state BMP programs (Table 10). This can likely be attributed to GCSAA’s initiative to develop golf-centric BMP manuals in all 50 states (5). Conversely, golf facility participation in legacy environmental stewardship programs (i.e., Audubon
Cooperative Sanctuary Program, Golf Environmental Organization and Epar USA) remains unchanged or has declined over time. More facilities are reporting their use of the GCSAA Integrated Pest Management (IPM) Planning Guide (13.9% in 2021 versus 5.9%
in 2015). Similarly, for the first time, an increasing number of facilities now report their use of “other IPM programs” (6.3%), “energy management programs” (4.6%), “other wildlife habitat management programs”
(3%) and “pollution prevention programs” (2.6%).
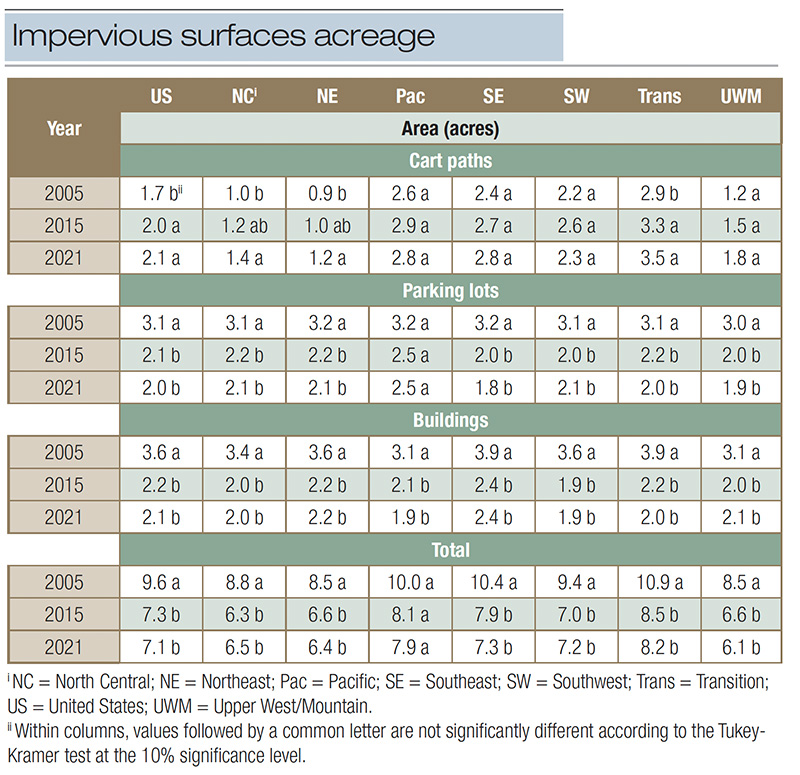
Table 8. Median acreage of impervious surfaces on U.S. golf facilities in 2005, 2015 and 2021.
Fewer facilities implemented changes either by adding or improving existing features in the five years preceding the 2021 survey (Table 11). It should be noted that the survey did not measure what environmental practices or features were already in place
and/or maintained. Of those features associated with reducing a facility’s environmental impact, additions or improvements declined from 2005 to 2021 except recycling, which did not change. Despite the overall reduction in the reporting of adding
or improving a particular feature, irrigation systems, recycling and native plantings were improved or added by 56%, 42% and 38% of golf facilities, respectively, in 2021. Similarly, additions or improvements to wild pollinator habitats and apiaries,
which were first reported in the 2015 survey, increased to 20% and 8% of golf facilities, respectively, from 2015 to 2021.
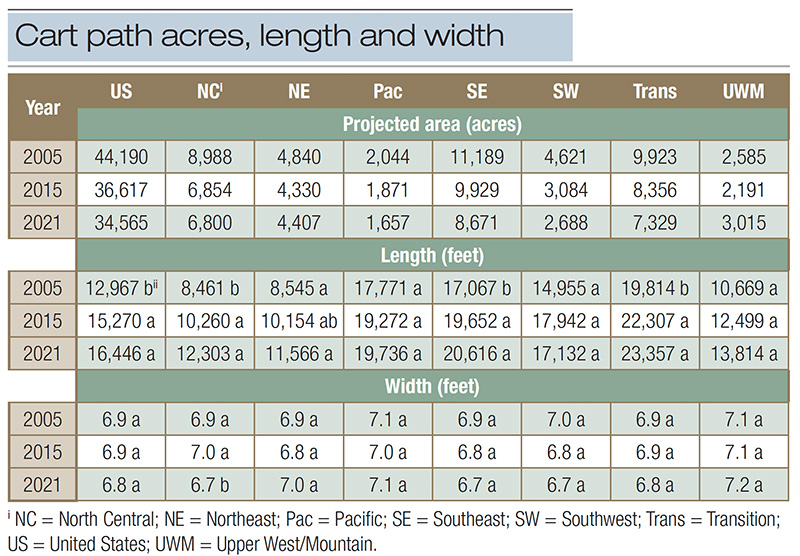
Table 9. Projected acres, median length, and median width of cart paths on U.S. golf facilities in 2005, 2015 and 2021.
Energy use and management
The frequency of golf facilities using gasoline and diesel fuel declined between 2008 and 2021 to 94.7% and 89.0%, respectively (Table 12). The use of natural gas more than doubled from 2005 to 2021 to 44% of golf facilities. The use of solar-electric,
geothermal and hydro-electric energy sources increased more than fourfold from 2008 to 2021 to 5.2%, 1.4% and 1.1%, respectively. Although the percentage of facilities using cleaner energy sources remains low, an increase from 2008 to 2021, coupled
with a decrease in gasoline and diesel, may indicate that golf facilities are exploring alternatives to gasoline and diesel. These findings may be a result of voluntary or compulsory change via governmental regulations. In some locations, such as
California, regulations have been implemented that prohibit engine exhaust and evaporative emissions from small off-road engines, which includes some turfgrass maintenance equipment (1). Such regulations have been identified as potential sources of
behavioral change on golf facilities (11). The survey instrument was not designed to determine the cause of behavioral changes. Thus, more research in this area would be necessary to determine if voluntary and/or compulsory actions contributed to
these changes.
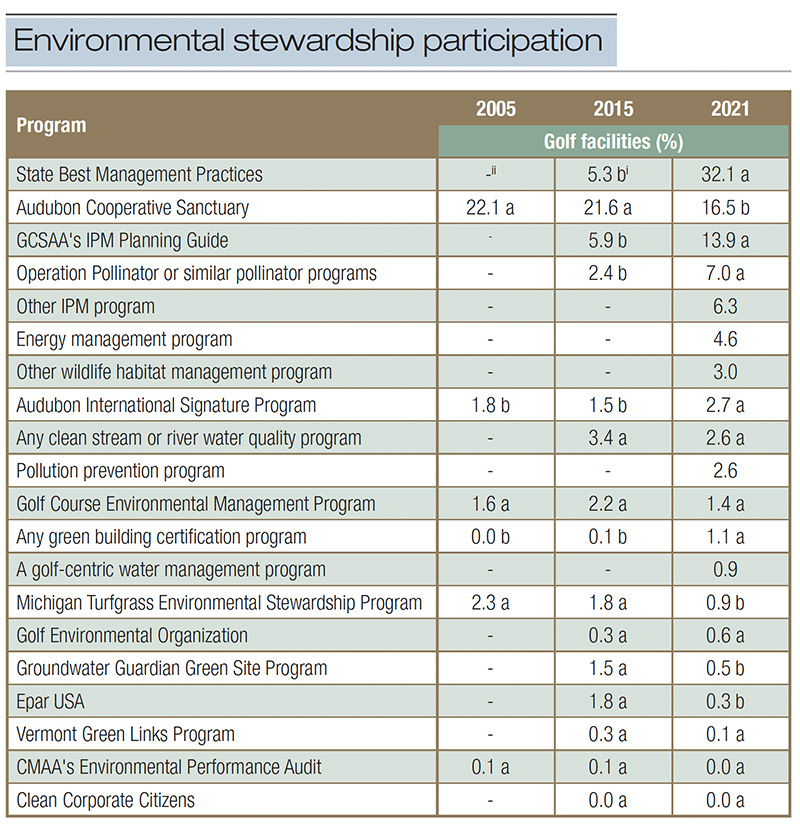
Table 10. Percent of U.S. golf facilities participating in environmental stewardship programs in 2005, 2015 and 2021.
The percentage of golf facilities that implemented behavioral, procedural or practice changes that may conserve energy decreased from 2008 to 2021 for each category except golf course maintenance equipment, which did not change from 2008 to 2021 (Figure
4). A similar result was measured for golf facilities that implemented physical, mechanical or design changes except for the categories of lighting and golf course maintenance equipment in which more golf facilities implemented changes to equipment
that may conserve energy in 2021 than in 2008 (Figure 5). Why nearly all behavioral changes declined, whereas some physical changes increased, is unknown.
The percentage of golf facilities that use a written energy plan remained below 5% and was less than that reported in 2008. The percentage of facilities that conducted an energy audit was 13% in 2021 and was equivalent to 2008. The percentage of golf
facilities that charged maintenance equipment and golf carts during nonpeak hours was 26% and 58%, respectively, and was equivalent to 2008. The percentage of golf facilities that delivered water to the pump station during nonpeak hours increased
to 94% from 2008 to 2021, whereas the percentage of golf facilities that acquired water for the pump station during nonpeak hours declined to 29% from 2008 to 2021.
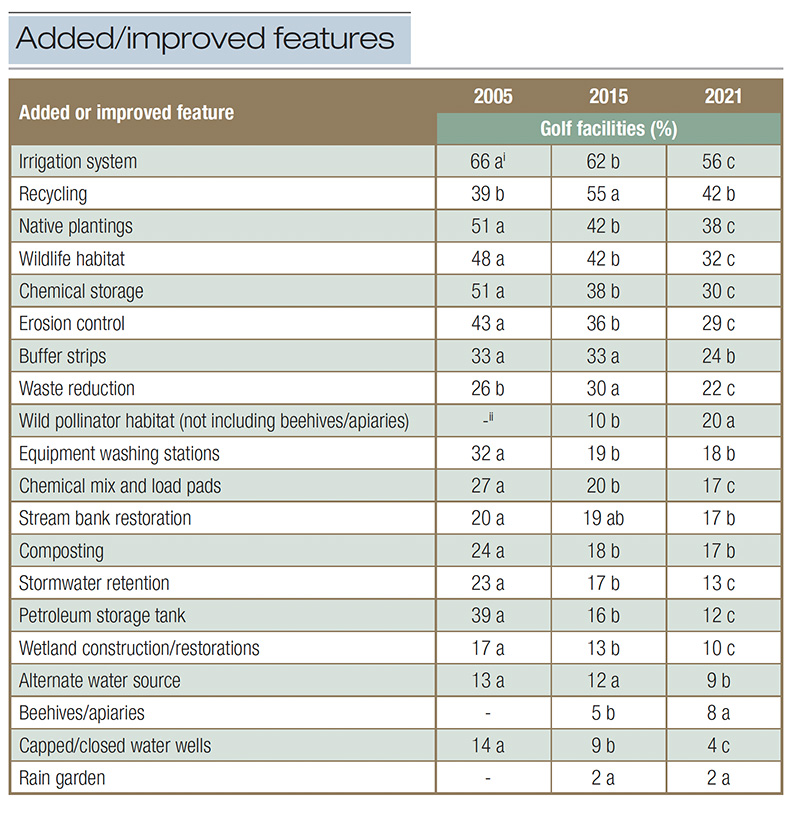
Table 11. Frequency of U.S. golf facilities that made an addition or improvement to the listed feature during the five years preceding 2005, 2015 and 2021. (i Within rows, values followed by a common letter are not significantly different according to the chi-square test at the 10% significance level. ii Question not asked in 2005.)
Conclusions and recommendations
Golf facilities report incorporating cleaner energy sources into their operations as evidenced by the reduction in facilities using gasoline and diesel and the increase in facilities using natural gas and solar-electric energy sources. The increase in
facilities implementing design changes should continue. The number of facilities implementing behavior changes to reduce energy use has declined and should be incorporated within facility operations to improve energy management strategies.
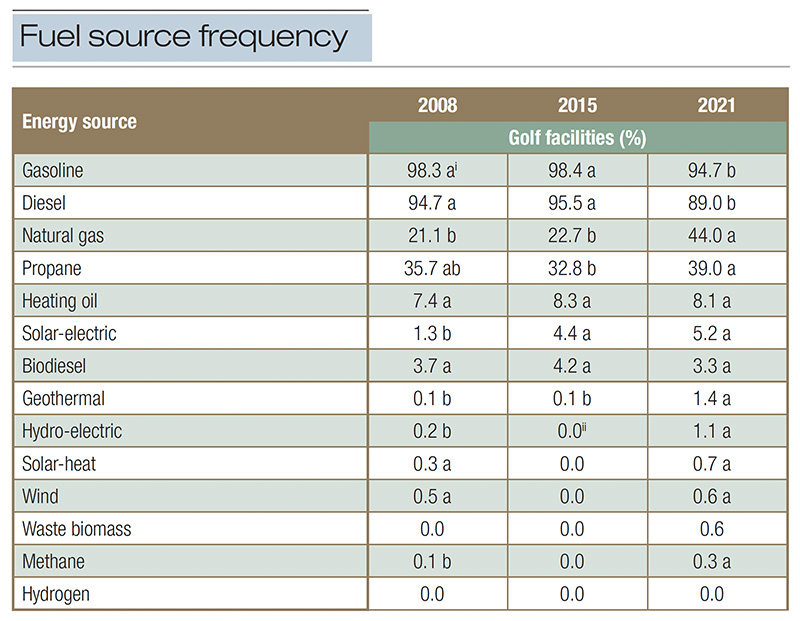
Table 12. Frequency of fuel source on U.S. golf facilities in 2008, 2015 and 2021. (i Within rows, values followed by a common letter are not significantly different according to the chi-square test at the 10% significance level. ii Values without variability were not analyzed.)
Since 2005, golf facilities have not reduced the median facility acreage but have reduced the median acreage of maintained turfgrass while simultaneously reducing the acreage of impervious surfaces. This indicates that golf facilities have made changes,
whether compulsory or voluntary, that align with BMPs of land use intended to reduce environmental impact. However, many BMPs were less frequently implemented in 2021 than 2008 and 2015. While this report does not provide the overall frequency of
these specific practices, golf course superintendents are encouraged to revisit land-use BMPs and determine which can be implemented and to what degree at their facility. Furthermore, setting resource conservation goals that are measurable and achievable
should be actively pursued at the facility level.
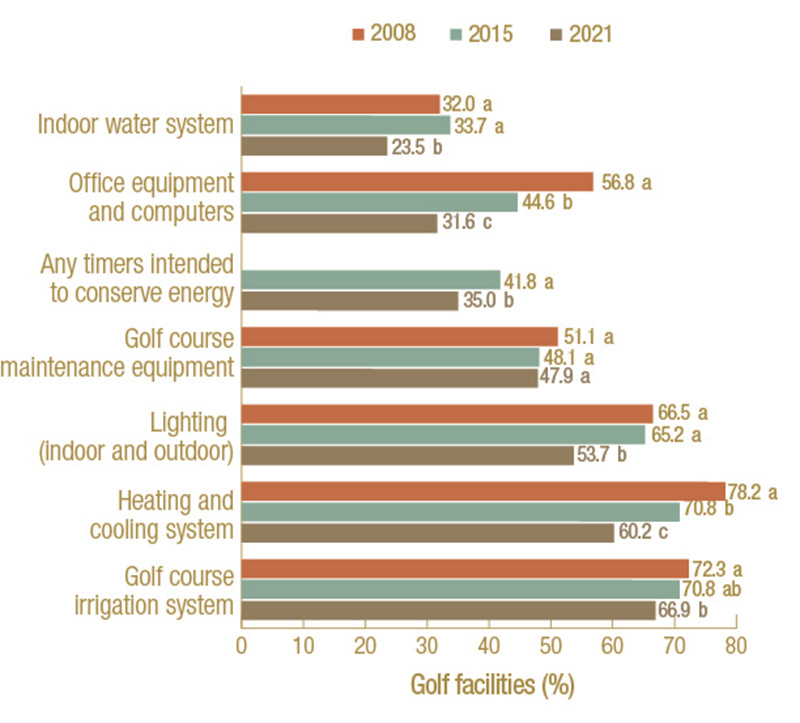
Figure 4. Frequency of U.S. golf facilities that reported incorporating behavioral, procedural or practice changes that may conserve energy in 2008, 2015 and 2021. Bars with a common letter are not significantly different according to chi-square test at the 10% significance level.
In the GCEP Phase II Land Use Characteristics Public Report, it was stated, “In future decades, it is unlikely that the dramatic improvements observed from 2005 to 2015 can be matched, as all the obvious and relatively straightforward changes will
have already been made” (4). As noted here and in other GCEP Phase III survey results (10, 11, 12, 13), large changes in resource conservation have generally been replaced by small, incremental changes. Therefore, moving the industry toward
improved sustainability necessitates heightened action across the golf course management industry. Golf-centric associations should strive to provide meaningful education and tools that benefit this resource conservation goal-setting endeavor. Furthermore,
funding agencies should bolster research opportunities aimed at better quantifying environmental impacts of BMPs and associated barriers to BMP implementation as well as identifying golfers’ knowledge, attitudes and perceptions about BMP implementation
on golf courses. A golf course superintendent’s quest to conserve or reduce facility inputs is not only dependent on their own efforts, but will rely on support from golfers, members and management. Success will be the result of broad acceptance
and support by all who enjoy the game of golf.
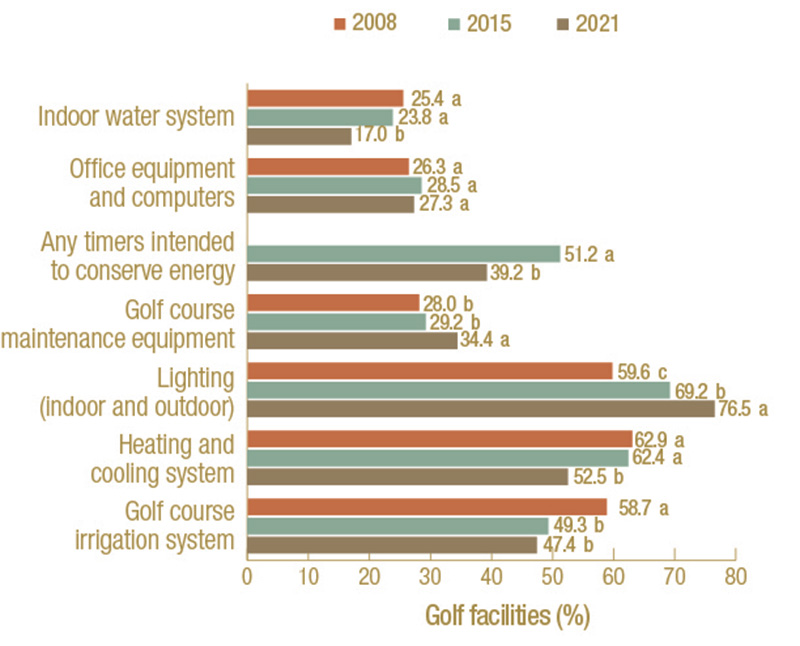
Figure 5. Frequency of U.S. golf facilities that reported incorporating physical, mechanical or design changes to equipment that may conserve energy in 2008, 2015 and 2021. Bars with a common letter are not significantly different according to chi-square test at the 10% significance level.
Funding
The third phase of the Golf Course Environmental Profile was conducted by GCSAA, with funding provided, in part, by the United States Golf Association.
The research says...
- Golf facilities report incorporating cleaner energy sources into their operations as evidenced by the reduction in facilities using gasoline and diesel and the increase in facilities using natural gas and solar-electric energy sources.
- Facilities implementing behavior changes to reduce energy use has declined and should be incorporated within facility operations to improve energy management strategies.
- Golf course superintendents are encouraged to revisit land-use BMPs and determine which can be implemented and to what degree at their facility. Furthermore, setting resource conservation goals that are measurable and achievable should be actively
pursued at the facility level.
- Large changes in resource conservation have generally been replaced by small, incremental changes. Therefore, moving the industry toward improved sustainability necessitates heightened action across the golf course management industry.
Literature cited
1. California Senate. 2021. AB-1346: Air pollution: small off-road engines. https://leginfo.legislature.ca.gov/faces/billTextClient.xhtml?bill_id=202120220AB1346 [accessed May 15, 2023].
2. Gelernter, W.D., L.J. Stowell, M.E. Johnson and C.D. Brown. 2017a. Documenting trends in land-use characteristics and environmental stewardship programs on U.S. golf courses. Crop, Forage and Turfgrass Management 3(1):1-12 (https://doi.org/10.2134/cftm2016.10.0066).
3. Gelernter, W.D., L.J. Stowell, M.E. Johnson and C.D. Brown. 2017b. Documenting trends in energy use and environmental practices on U.S. golf courses. Crop, Forage and Turfgrass Management 3(1):1-7. https://doi.org/10.2134/cftm2017.07.0044.
4. GCSAA. 2017. Land use characteristics and environmental stewardship programs on U.S. golf courses. https://www.gcsaa.org/docs/default-source/Environment/phase-2-land-use-survey-full-report.pdf?sfvrsn=c750ea3e_2 [accessed May 15, 2023].
5. GCSAA. 2021. Complete! Golf course environmental BMPs established for all 50 states https://www.gcmonline.com/course/environment/news/golf-course-state-bmps [accessed May 15, 2023].
6. Hall, C.R., A.W. Hodges, H. Khachatryan and M.A. Palma. 2020. Economic contributions of the green industry in the United States in 2018. Journal of Environmental Horticulture 38(3):73-79 (https://doi.org/10.24266/0738-2898-38.3.73).
7. Lyman, G.T., M.E. Johnson, G.A. Stacey and C.D. Brown. 2012. Golf course environmental profile measures energy use and energy management practices. Applied Turfgrass Science 9(1):1-16 (https://doi.org/10.1094/ATS-2012-0228-01-RS).
8. Lyman, G.T., C.S. Throssell, M.E. Johnson, G.A. Stacey and C.D. Brown 2007. Golf course profile describes turfgrass, landscape, and environmental stewardship features. Applied Turfgrass Science 4(1):1-25 (https://doi.org/10.1094/ATS-2007-1107-01-RS).
9. National Golf Foundation. 2023. American Golf Industry Coalition: 2022 Impact Report. https://www.golfcoalition.org/_files/ugd/e10443_74f0b4605e1144daa7da7f1cf2403ef9.pdf [accessed May 15, 2023].
10. Shaddox, T.W., J.B. Unruh, M.E. Johnson, C.D. Brown and G. Stacey. 2022. Water use and management practices on U.S. golf courses. Crop, Forage and Turfgrass Management 8:e20182 (https://doi.org/10.1002/cft2.20182).
11. Shaddox, T.W., J.B. Unruh, M.E. Johnson, C.D. Brown and G. Stacey. 2023a. Nutrient use and management practices on United States golf courses. HortTechnology 33(1):79-97 (https://doi.org/10.21273/horttech05118-22).
12. Shaddox, T.W., J.B. Unruh, M.E. Johnson, C.D. Brown, and G. Stacey. 2023b. Survey of pest management practices on U.S. golf courses.
HortTechnology 33(2):152-156 (https://doi.org/10.21273/HORTTECH05117-22).
13. Shaddox, T.W., J.B. Unruh, M.E. Johnson, C.D. Brown and G. Stacey. 2023c. Land-use and energy practices on U.S. golf courses. HortTechnology 33(3):296-304 (https://doi.org/10.21273/
HORTTECH05207-23).
J. Bryan Unruh, Ph.D., (jbu@ufl.edu) is a professor and associate center director at the University of Florida, Institute of Food and Agricultural Sciences’ West Florida Research and Education Center in Jay, Fla. Travis Shaddox, Ph.D., is president
of Bluegrass Art and Science LLC, Lexington, Ky.