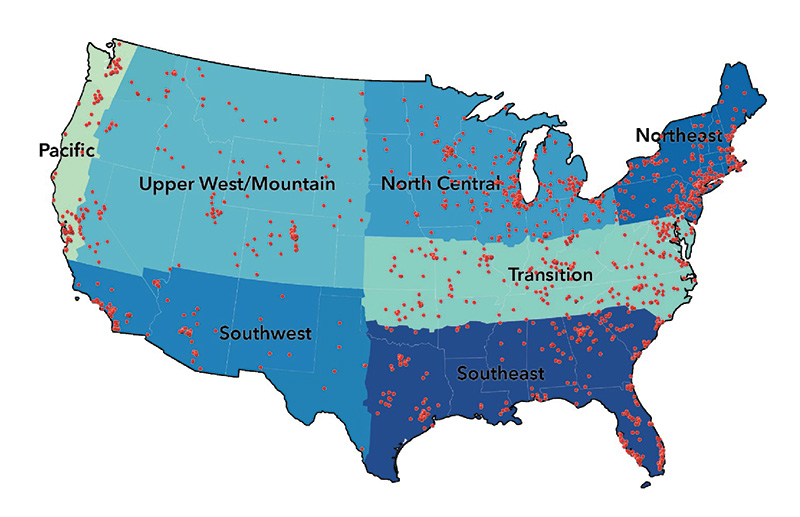
Figure 1. Geographical distribution of respondents to GCSAA's surveys and the designated agronomic regions.
Nutrient management is one of the most important components of a comprehensive best management practices (BMPs) program implemented on golf courses. Proper plant nutrition, often driven by fertilizer inputs, greatly impacts turfgrass health and performance.
Nutrient use on golf courses is an important management practice that increases management cost and has the potential to influence ecosystems. Therefore, assessing nutrient use and management practices are critical to the development, teaching and
adoption of BMPs.
In 2006, GCSAA initiated the Golf Course Environmental Profile (GCEP) Survey Series to develop a comprehensive environmental profile of golf courses in the United States. The objective was to establish baseline data on issues ranging from land use to
regulations and practices governing water use, nutrients and pest control. A follow-up set of surveys was conducted starting in 2014 and provided scientifically valid measurements of industry change as it related to energy use and environmental practices
on U.S. golf courses; land use characteristics and environmental stewardship programs on U.S. golf courses; pest management practices on U.S. golf courses; nutrient use and management on U.S. golf courses; and water use and conservation practices
on U.S. golf courses.
The survey series, now in its third iteration, serves as the golf course management industry’s benchmark by providing comprehensive data on the management practices, property features and environmental stewardship of U.S. golf courses. These survey
results are frequently used by those interested in the golf course management industry to document changes in environmental practices over time; assist in determining the future direction of GCSAA environmental efforts and education; identify key
issues for potential research projects; respond to governmental and public inquiries; promote the efforts superintendents are making on their golf courses; and provide a solid basis for comments on proposed regulatory issues.
Results from the surveys are available in online documents (https://www.gcsaa.org/Environment/golf-course-environmental-profile) and in GCM, and they are published in peer-reviewed scientific journals including Crop, Forage and Turfgrass Management (previously
Applied Turfgrass Science) and HortTechnology, benefiting scientists who routinely use the survey data to inform their research direction and regulators who support evidence-based decisions.
In this article, we summarize the results from the 2021 survey on nutrient use and management practices on U.S. golf courses and determine if changes have occurred since 2006.
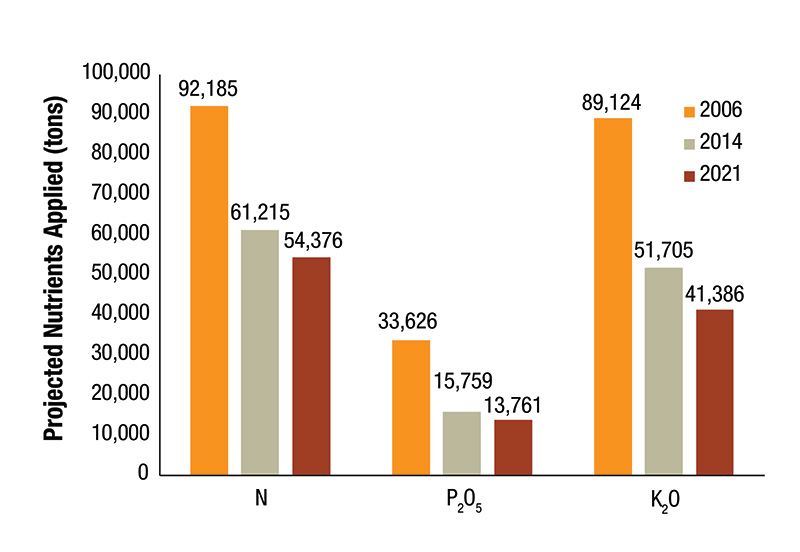
Figure 2. Projected N, P2O5 and K2O applied on U.S. facilities in 2006, 2014 and 2021.
Methodology
An electronic survey instrument was developed with questions that were identical to those used in 2006 and 2014. A survey link was emailed to golf facilities using the mailing lists of the National Golf Foundation and GCSAA, which resulted in the link
being sent to 14,033 golf facilities. A golf facility was defined as a business where golf could be played on one or more golf courses. The survey was available for completion for seven consecutive weeks beginning on April 1, 2022. Respondents remained
anonymous, and 2021 data were merged with data from the same surveys conducted in 2006 and 2014 to allow for a measurement of change over time. Responses were received from 1,444 facilities, which represented 10.3% of the known total of U.S. golf
facilities.
Respondents were asked to provide nutrient data according to the guaranteed analysis on the fertilizer label (1). Therefore, nitrogen, phosphorus and potassium were reported as N, P2O5 and K2O.
Respondents were stratified by agronomic region (Figure 1). To provide a valid representation of U.S. golf courses, data were weighted. Responses were categorized into one of 35 categories depending upon the facility type (public or private), number of
holes (9, 18 or 27 plus), and public green fee (less than $55 or greater than or equal to $55 per round). The weights were calculated by determining the proportion of each group within the total survey response.
Projected applied nutrients were determined by multiplying the number of golf facilities by the percentage that applied nutrients on a given course feature, and then multiplying that value by the average amount of nutrient applied. Projected fertilized
acres were determined by dividing the total pounds of nutrients applied by the average pounds per 1,000 square feet and then converted to acres. Mean separations were not conducted on projected values.
To determine if survey responses changed over time, years were paired. Differences among all-pairwise comparisons were determined using the chi-square test at the 10% significance level.
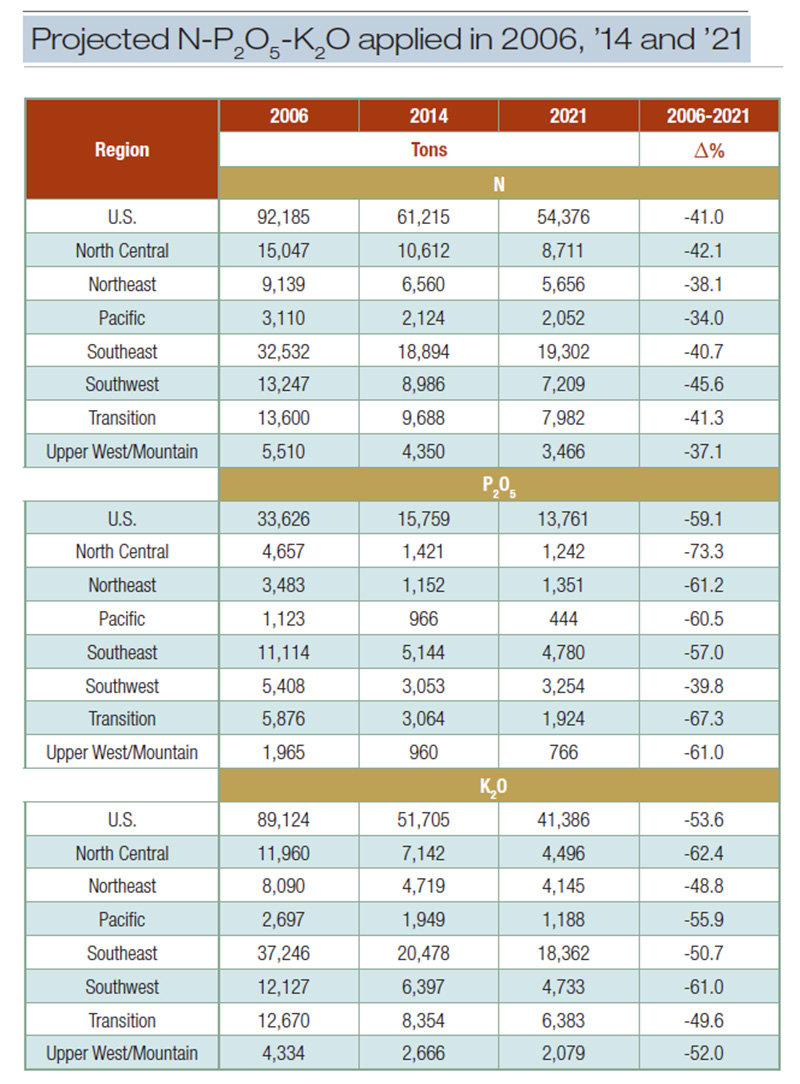
Table 1. Projected nitrogen (N), available phosphorus (P2O5), and soluble potash (K2O) applied to U.S. golf courses in 2006, 2014, and 2021.
Results
Nutrient use
U.S. golf courses continue to reduce their nutrient use with annual reductions of 41% (37,809 tons) of nitrogen, 59% (19,865 tons) of phosphorus and 54% (47,738 tons) of potassium since 2006 (Figure 2).
Nutrient use reductions for all three macronutrients were observed in each of the seven agronomic regions and ranged from 34%-46% for nitrogen, 40%-73% for phosphorus and 49%-62% for potassium (Table 1). These reductions are attributed to several factors
— golf facility closures, reductions in nutrient application rates and reductions in fertilized acreage.
Changes in nutrient use due to reductions in the number of golf facilities
Golf facility closures continue to outpace facility openings, resulting in a net reduction of golf facilities from 2006 to 2021 nationally (12%) and regionally (ranging from 5% in the Upper West/Mountain to 15% in the Southeast) (Table 2). Facility closures
reduced applied nitrogen, phosphorus and potassium by 5,027, 1,536 and 3,952 tons, respectively.
Changes in nutrient use due to reductions in nutrient application rates
Nutrient application rates at operational golf facilities have declined since 2006. The nutrient application rate is possibly the most effective measurement of efficient nutrient usage because it is not affected by facility closures. Across all course
features, the national median of nitrogen, phosphorus and potassium applied per 1,000 square feet per golf facility declined from 2006 to 2021 by 30%, 63% and 42% to 1.6, 0.3 and 1.1 pounds per 1,000 square feet (78.1, 14.7 and 53.7 kilograms per
hectare), respectively (Table 3).
Averaged across the U.S., golf course superintendents reported reduced nitrogen application rates on each course feature except on natural areas, which received the lowest nitrogen rate of any course feature (Figure 3). These rate reductions ranged from
18% to 28% depending upon the course feature.
Putting green nitrogen rates were reduced in all agronomic regions ranging from 24% to 31% (Table 4). Similarly, nitrogen rate reductions on tees ranged from 15% in the Upper West/Mountain to 31% in the Northeast and Southeast. Likewise, fairway nitrogen
rates were reduced in all regions except the Southwest and ranged from 14% to 32% in the Upper West/Mountain and Northeast, respectively. Nitrogen rate reductions on golf course roughs were reported in all regions except the Southwest.
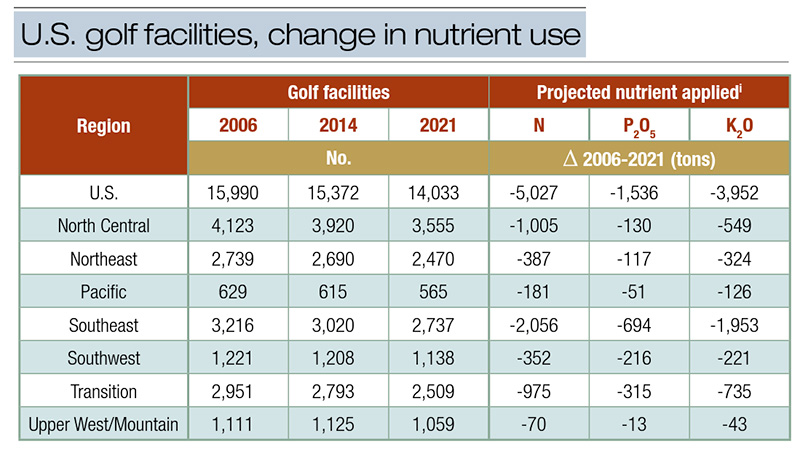
Table 2. Number of U.S. golf facilities in 2006, 2014, and 2021 and the projected change in nutrient use. i Determined by multiplying the change in golf facilities from 2006 to 2021 by the average amount of N, P2O5, or K2O applied.
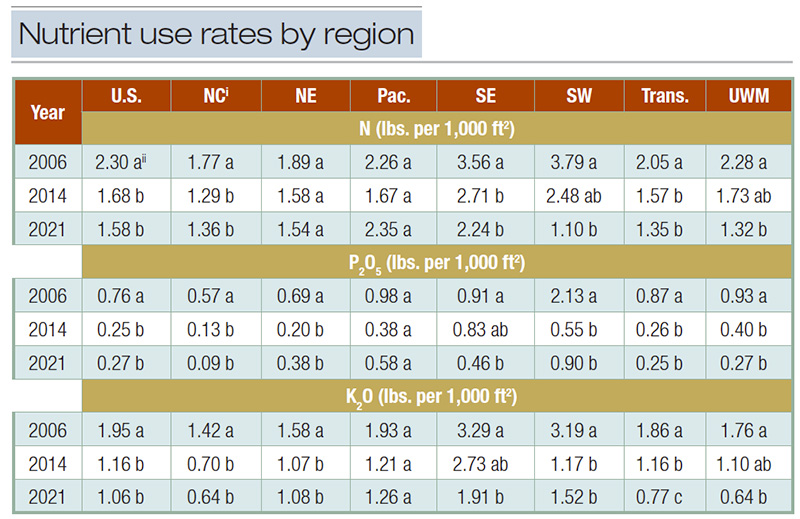
Table 3. Nitrogen (N), available phosphorus (P2O5), and soluble potash (K2O) use rates on U.S. golf facilities in 2006, 2014 and 2021. ii Within columns, values followed by a common letter are not significantly different according to the Tukey-Kramer test at the 10% significance level.
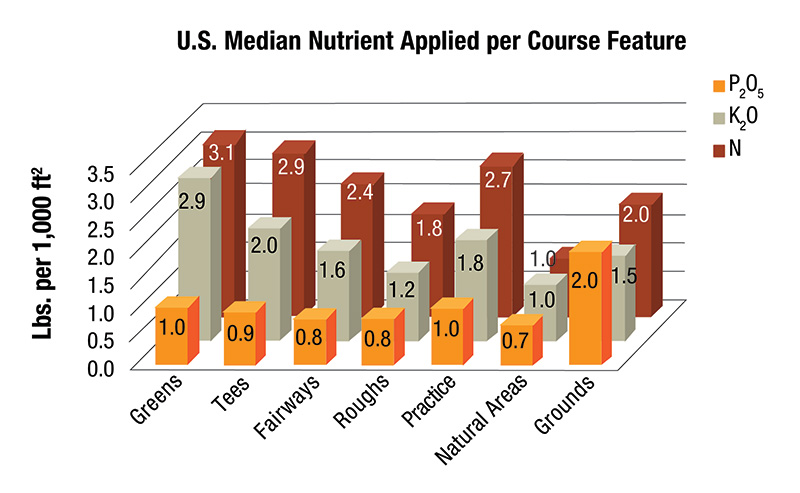
Figure 3. Application rates of N, P2O5 and K2O on U.S. golf facilities by course feature in 2021.
Similarly, phosphorus and potassium application rates declined across the U.S. from 2006 to 2021 by 63% and 42%, respectively, and within each region except the Pacific (Tables 5 and 6). Nationally and regionally, the greatest phosphorus and potassium
application rates were reported on putting greens and grounds. Reductions in phosphorus application rates have not changed from 2006 to 2021 for roughs, practice areas and natural areas in four of the seven regions.
With few exceptions, applied potassium reduction ranged from 23% to 50% for all course features in all regions except in natural areas, where no changes were reported.
Changes in nutrient use due to reductions in the number of fertilized acres
Another factor that likely influenced nutrient use reductions is the reduction in the number of acres fertilized with nitrogen, phosphorus and potassium, which declined by 25%, 53% and 32%, respectively, from 2006 to 2021 (Table 7). Nationally, the greatest
decrease was with phosphorus, with which golf course superintendents fertilized approximately 530,000 fewer acres in 2021 compared to 2006.
Survey results revealed regional variation in the changes to the number of fertilized acres. Changes in acres fertilized with nitrogen ranged from 21% in the Upper West/Mountain to 37% in the Southwest. The reduction in acres fertilized with phosphorus
was more variable and ranged from 31% in the Upper West/Mountain region to 70% in the North Central region. Similarly, fewer acres were fertilized with potassium, and reductions ranged from 28% in the Upper West/Mountain and Southeast to 40% in the
Southwest.
When looking at course features, the greatest median fertilized acres were roughs, followed by fairways and natural areas. Pooled across the U.S., fertilized rough acreage remained unchanged from 2006-2021.
Superintendents reported increases in fertilized acres of natural areas (25%), greens (13%) and tees (9%) from 2006 to 2021. However, fertilized acres of fairways, practice areas and grounds were reduced by 9%, 27% and 35%, respectively, from 2006-2021.
During this same time, in all regions of the U.S. (except the Pacific), fertilized acres were reduced (25% to 44%) in the non-play area denoted as “grounds.”
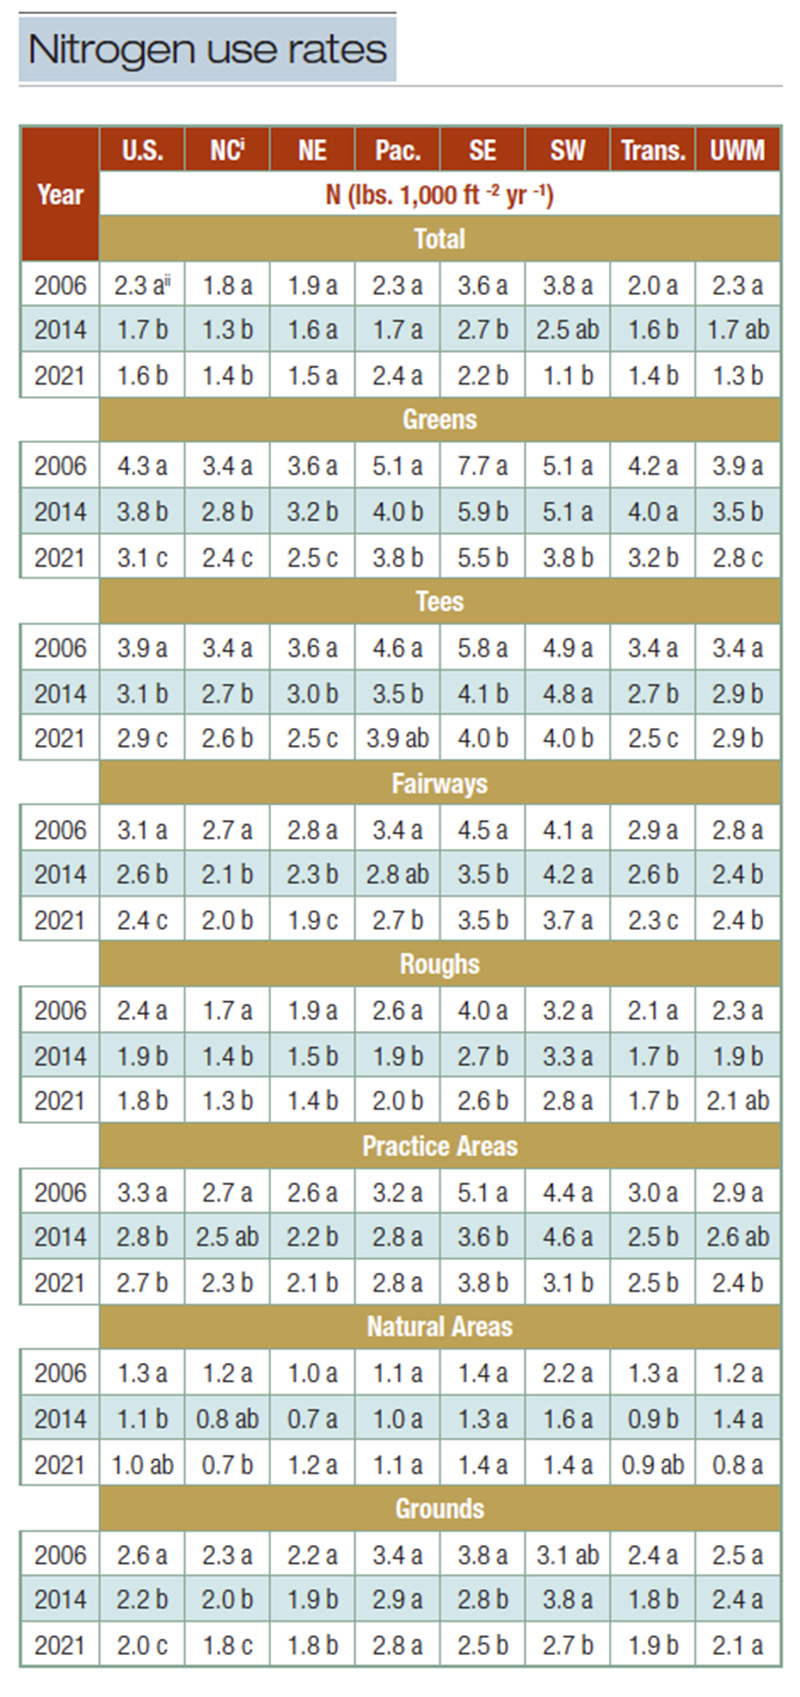
Table 4. Nitrogen (N) use rates on U.S. golf facilities in 2006, 2014 and 2021. i NC, North Central; NE, Northeast; Pac., Pacific; SE, Southeast; SW, Southwest; Trans., Transition; UWM, Upper West/Mountain. ii Within columns, values followed by a common letter are not significantly different according to the Tukey-Kramer test at the 10% significance level.
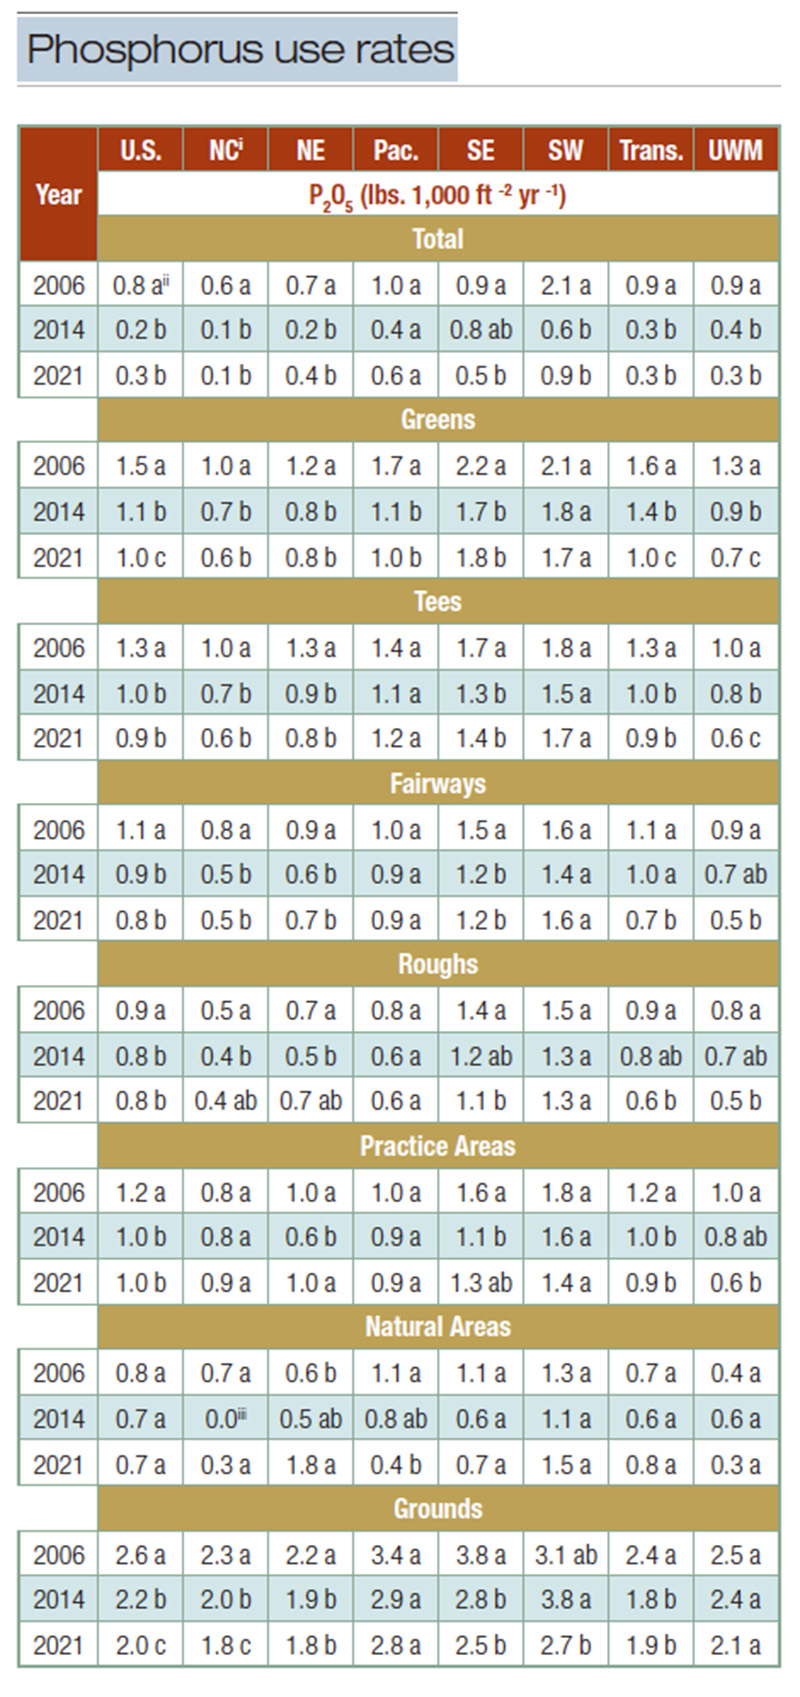
Table 5. Available phosphorus (P2O5) use rates on U.S. golf facilities in 2006, 2014 and 2021. i NC, North Central; NE, Northeast; Pac., Pacific; SE, Southeast; SW, Southwest; Trans., Transition; UWM, Upper West/Mountain.
ii Within columns, values followed by a common letter are not significantly different according to the Tukey-Kramer test at the 10% significance level.
iii Values without variability were not analyzed.
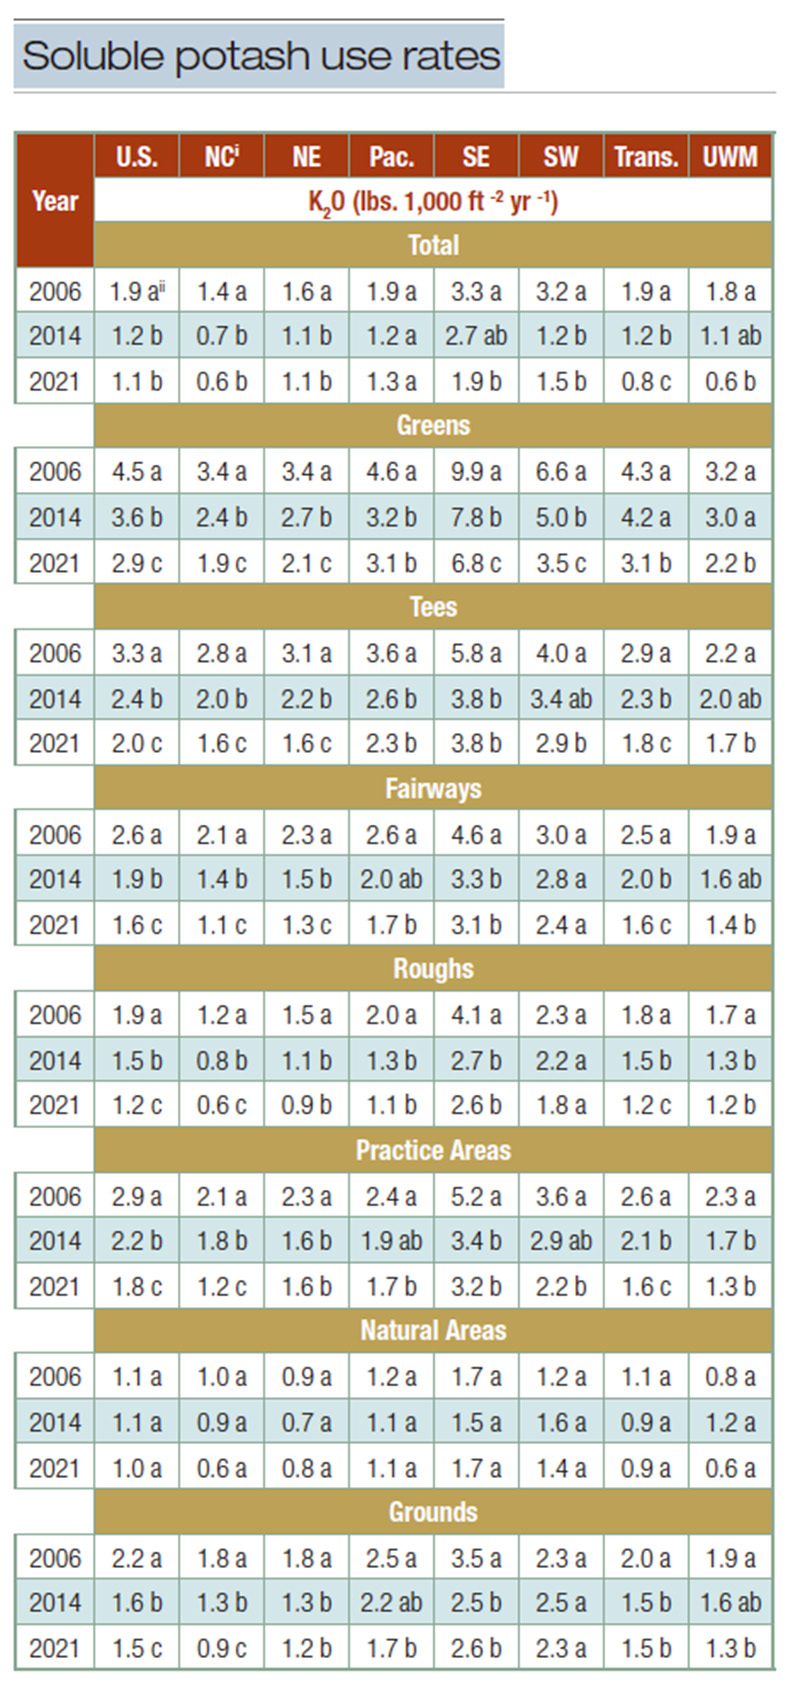
Table 6. Soluble potash (K2O) use rates on U.S. golf facilities in 2006, 2014 and 2021. i NC, North Central; NE, Northeast; Pac., Pacific; SE, Southeast; SW, Southwest; Trans., Transition; UWM, Upper West/Mountain. ii Within columns, values followed by a common letter are not significantly different according to the Tukey-Kramer test at the 10% significance level.
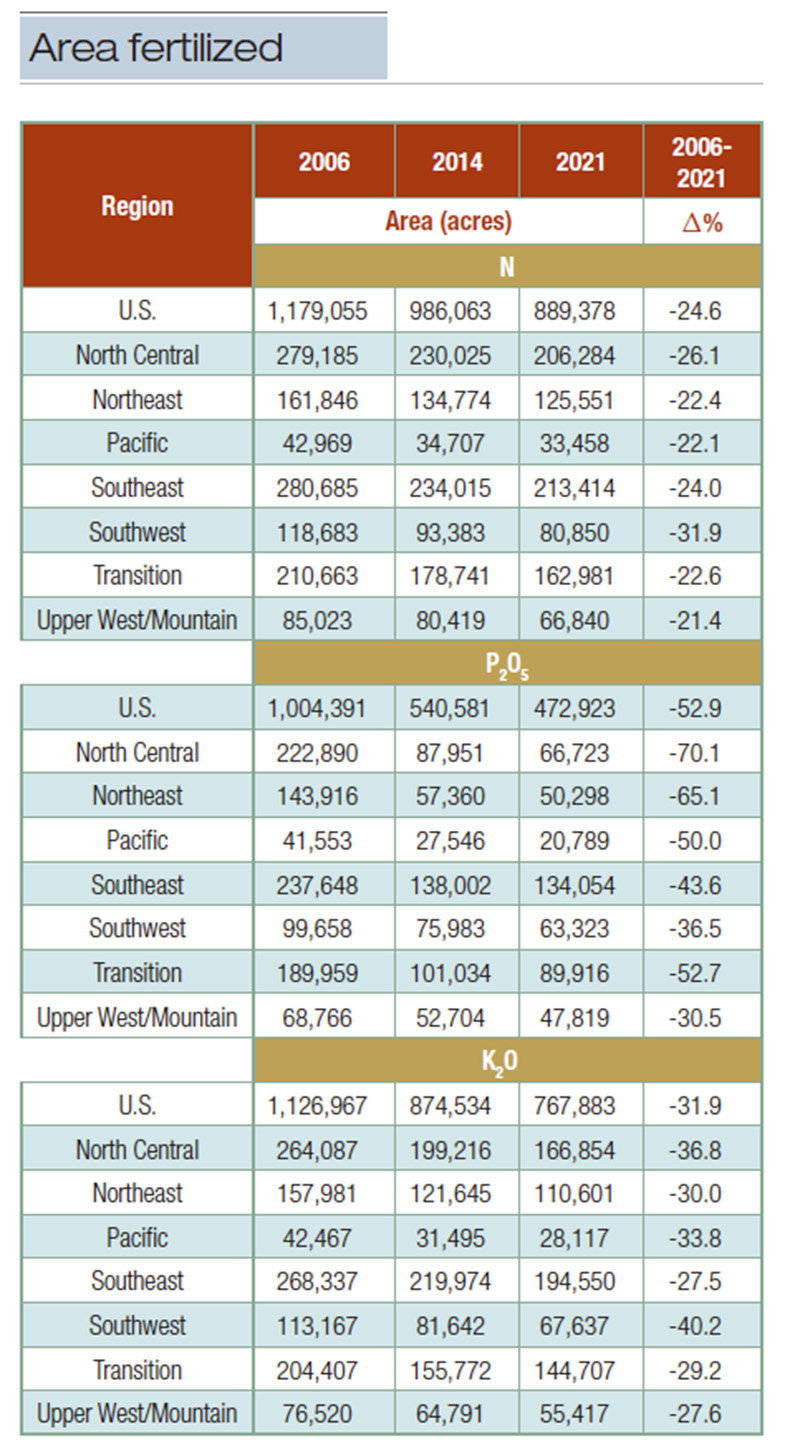
Table 7. Projected acres fertilized with nitrogen (N), available phosphorus (P2O5), and soluble potash (K2O) on U.S. golf facilities in 2006, 2014 and 2021.
Imposed restrictions on nutrient applications
The 2014 survey revealed a significant increase over the 2006 baseline survey in the frequency of federal, state, local government or tribal authority restrictions on nutrient applications. Interestingly, the frequency of such restrictions in 2021 was
either diminished or remained the same as 2014 but were still greater than 2006 (Table 8). The impact of these restrictions can be observed, particularly with phosphorus applications. Between 2006 and 2021, the percentage of golf facilities that operate
under phosphorus restrictions increased from 5% to 15% (Table 8). In 2006, 92% of golf facilities applied phosphorus to greens, whereas in 2021 that percentage declined to 75% (data not presented). Perhaps the most impactful change occurred on fairways
and roughs, where the percentage of golf facilities applying phosphorus declined by nearly half from 2006 to 2021 (data not presented).
Additionally, in 2021, the phosphorus application rate on golf facilities that operated within phosphorus restrictions was 0.09 pounds per 1,000 square feet (4.39 kilograms per hectare) compared to 0.32 pounds per 1,000 square feet (15.62 kilograms per
hectare) on facilities not governed by restrictions (Figure 4). Conversely, less than 4% of facilities were subjected to nitrogen or potassium restrictions, and no differences were measured between the rate of nitrogen and potassium applied on facilities
subjected or not subjected to nutrient restrictions (data not presented). Thus, mandated restrictions on phosphorus applications appear to have resulted in reduced amounts of phosphorus applied and have likely increased the percentage of golf facilities
that eliminated phosphorus applications altogether.
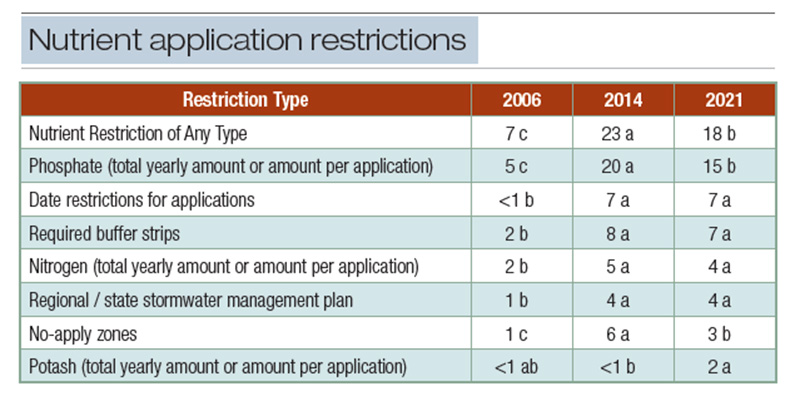
Table 8. Frequency of federal, state, local government, or tribal authority restrictions on nutrient applications on U.S. golf facilities in 2006, 2014 and 2021. i Within rows, values followed by a common letter are not significantly different according to the χ2 test at
the 10% significance level.
Nutrient management practices
Survey respondents were asked about the management practices they used with the intent of reducing reliance upon applied nutrients (i.e., fertilizer) (Figure 5). Similar to the responses from the 2014 survey, the three most common management practices
adopted by golf course superintendents as a means of reducing reliance upon applied nutrients were: 1. Fertilize based on soil test results; 2. Return clippings; and 3. Make precision fertilizer applications.
Consistent with 2014 survey results reported by Gelernter et al. (2), golf facilities that conduct soil tests applied more nitrogen and potassium to each course feature in 2021 except natural areas (Figure 6). Soil testing was less associated with phosphorus,
as application rates were comparable between facilities that conducted soil tests and facilities that did not. Gelernter et al. (2016) (2) postulated that the higher rates used by those that soil test may be attributed to soil test interpretations
that target nutrient levels higher than those required for acceptable turf growth. Though plausible, other factors may contribute to the increased application rates, necessitating further research to better understand the association of soil testing
and applied nutrients.
Other notable survey results include the significant increase since 2014 in facilities that use plant growth models to determine fertilizer rate and frequency (25% in 2021 versus 19% in 2014) and the percentage of facilities that have stopped overseeding
(10% in 2021 versus 8% in 2014).
One area needing improvement is related to the nutrient content in reclaimed water. Reclaimed water generally contains nitrogen and phosphorus, yet in 2021, fewer golf course superintendents indicated they considered the nutrients in reclaimed water with
the intent of reducing reliance on applied nutrients (Figure 5). Furthermore, golf course superintendents ranked the nutrient content of the effluent water source as the third-least-important factor (out of 22) when making nutrient application decisions
(Table 9). Considering that 13% of U.S. golf facilities used reclaimed water in 2020, accounting for 21% of irrigation water used on golf courses (6), greater attention needs to be given to accounting for this source of nutrients applied to golf courses.
When looking at course features, the greatest median fertilized acres were roughs, followed by fairways and natural areas. Pooled across the U.S., fertilized rough acreage remained unchanged from 2006-2021.
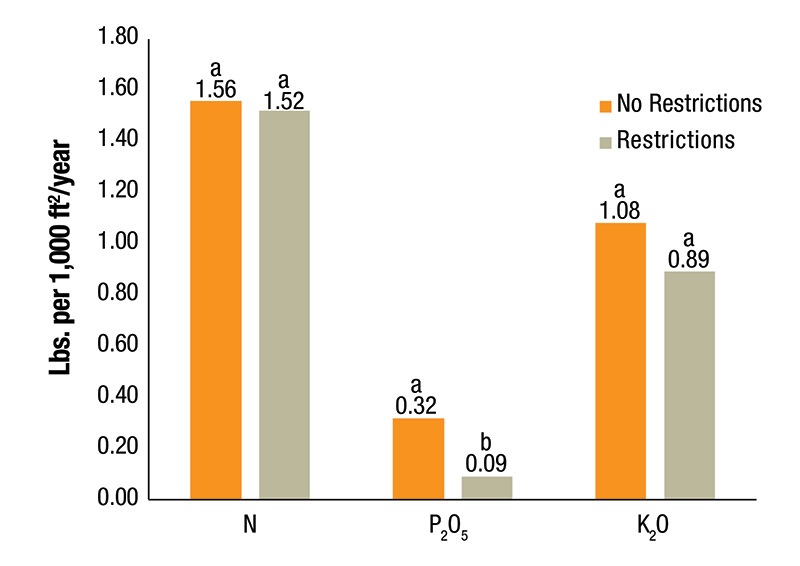
Figure 4. Application rates of N, P2O5 and K2O on U.S. golf facilities associated with federal, state, tribal or local nutrient restrictions in 2021. Bars with a common letter are not significantly different according to the Tukey-Kramer test at the 10% significance level.
Nutrient management plans and decision factors
Written nutrient management plans are important tools that guide nutrient applications, resulting in increased nutrient-use efficiency. Across the U.S., 43% of golf facilities reported having a written nutrient management plan, with the percentage varying
across regions from 35% in the Northeast to 52% in the North Central (data not presented). The percentage of golf facilities using written nutrient management plans remained equivalent to those in 2006.
However, recent educational efforts have resulted in the development of state and facility-specific best management practices which may drive increased adoption of written nutrient management plans by GCSAA (3).
Consistent with results from prior surveys, the three most important factors used when making nutrient application decisions in 2021 were visual observation, weather and previous product performance (Table 9). Turfgrass wear, cost of fertilizer, regulatory
requirements, growth prediction models and adjacent property owner’s maintenance standards increased in importance from 2006 to 2021, whereas most of the remaining decision factors were rated less important in 2021 than in 2006.
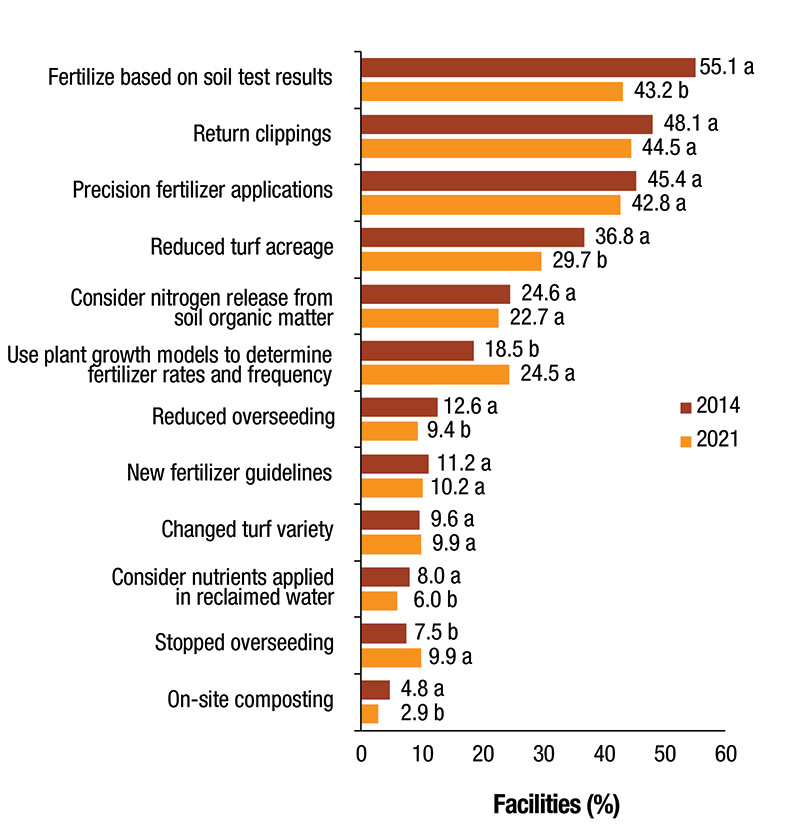
Figure 5. Frequency of management practices used on U.S. golf facilities with the intent of reducing reliance on applied nutrients in 2014 and 2021. Bars with a common letter are not significantly different according to the χ2 test at the 10% significance level.
Changes in fertilizer sources
Notable shifts in fertilizer sources used on golf courses were evident in 2021. Natural organic sources were used less nationally and within the North Central, Northeast, Southwest and Transition regions in 2021 (Table 10). Similarly, for the first time
since 2006, the use of slow-release nitrogen declined nationally and within the North Central, Northeast, Southeast and Southwest regions (Table 11). In tandem, the use of quick-release nitrogen increased nationally and within the North Central, Northeast
and Southeast regions. It is unknown what factors led to these changes. However, in November 2021, the cost of urea more than tripled compared to November 2020 and reached a historic high of $900 per metric ton (3). Furthermore, natural organic fertilizers
may be as much as seven times more expensive than urea (5).
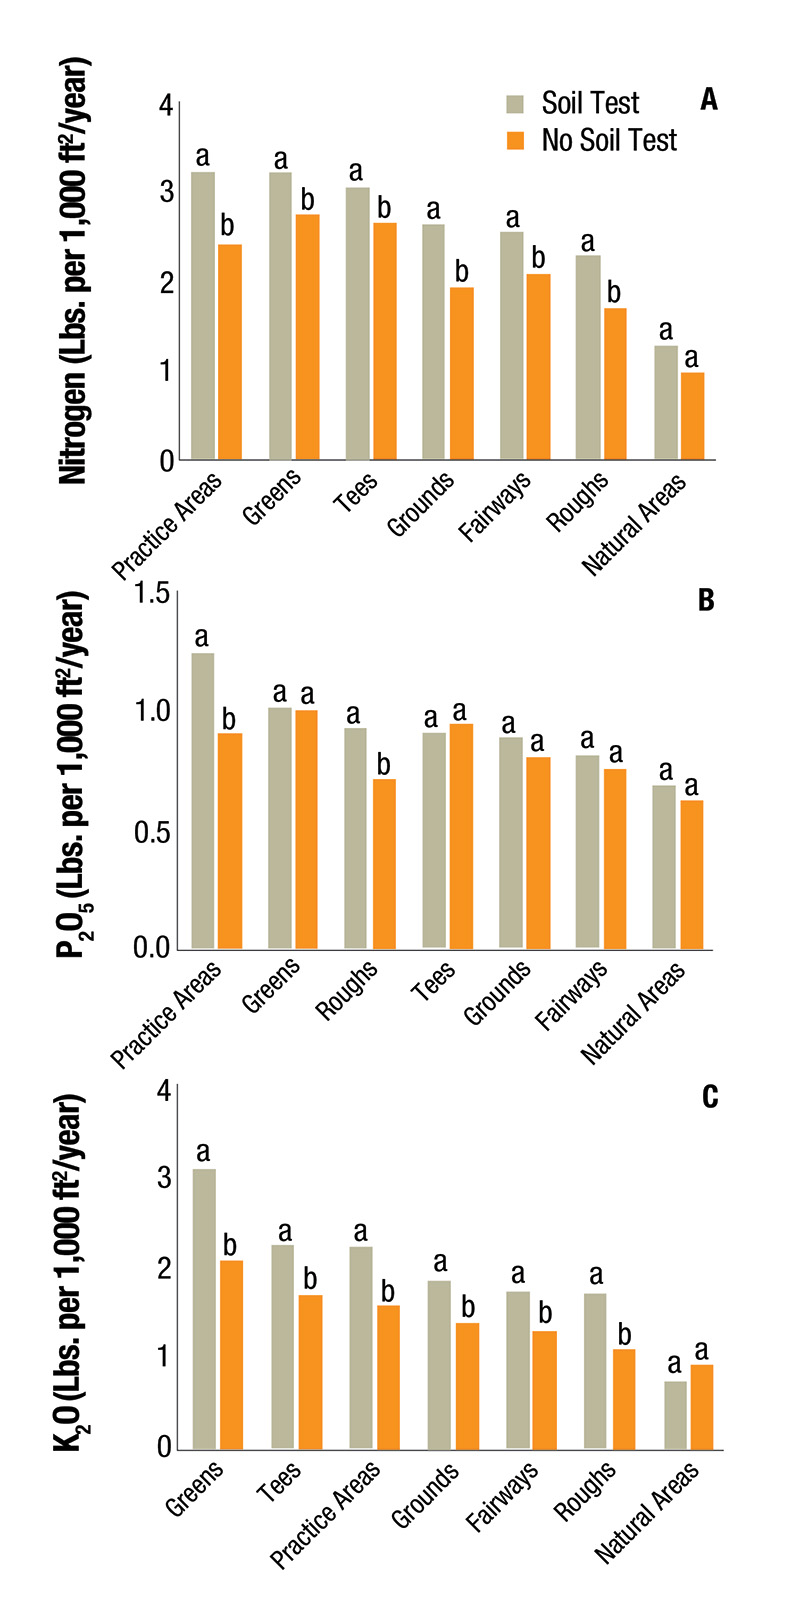
Figure 6. Use rates of A.) nitrogen, B.) available phosphorous (P2O5), and C.) soluble potash (K2O) on U.S. golf facilities that soil tested or did not soil test in 2021. Bars with a common letter are not significantly different according to the Tukey-Kramer test at the 10% significance level.
Soil amendments and supplements
The percentage of golf facilities using soil amendments continues to increase, with 84% reporting that at least one amendment was used on their facility (Table 12). The use of all amendments, except limestone, have increased since 2006. The most common
soil amendments used were humic substances, amino acids and biostimulants, with 50% or more of golf facilities using at least one of the three.
Application frequency
The number of nutrient applications per year made to greens, tees and fairways increased from 2006 to 2021 (Table 13). More frequent applications afford golf course superintendents greater control over their turfgrass nutrition program. This likely explains
much of the increase in application frequency. The previously noted reduction in slow-release nitrogen and concomitant increase in quick-release nitrogen supports this postulate. Liquid applications of soluble nitrogen sources generally provide greater
application precision compared to granular fertilizers but necessitates lower rates to reduce the risk of injury. Consequently, liquid fertilizers are applied frequently but at low rates, which may explain the increase in the number of nutrient applications.
Additionally, the noted increase in usage of some amendments that are commonly in a liquid form, such as amino acids, may also play a role in the increase in nutrient applications.
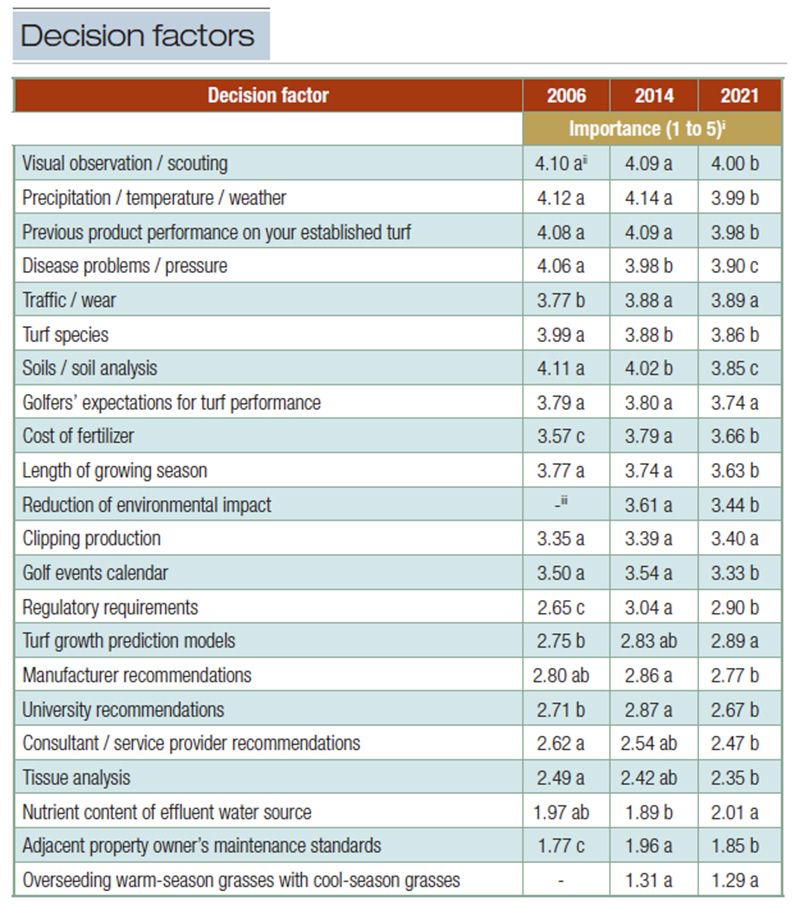
Table 9. Importance of factors when making nutrient application decisions on U.S. golf facilities in 2006, 2014 and 2021. i Respondents rated factors on a 1–5 scale, where 1 = not important at all, and 5 = extremely important.
ii Within rows, values followed by a common letter are not significantly different according to the Tukey-Kramer test at the 10% significance level.
iii Not asked in 2006.
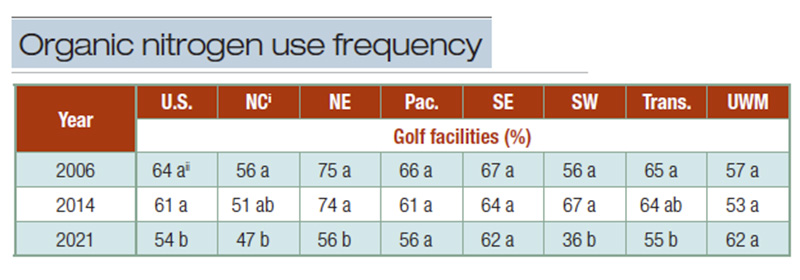
Table 10. Frequency of natural organic nitrogen use on U.S. golf facilities in 2006, 2014 and 2021. ii Within columns, values followed by a common letter are not significantly different according to the χ2 test at the 10% significance level..
Calibrated equipment and fertilizer storage
Spreader calibration is a vital component of efficient nutrient management. Nationally, and in most regions, the percentage of nutrient applications made with calibrated equipment decreased on each course feature, and no region reported an increase since
2006 or 2014 (Data not presented). Nationally, approximately one-half of nutrient applications made on golf facilities are made with calibrated equipment, which, in turn, indicates the remaining half is not.
Improperly stored fertilizer represents potential point-source pollution, as any mishap can be traced back to that specific location. It appears U.S. golf facilities recognize this concern, as the percentage of facilities that have storage appropriate
for fertilizer has increased in every region except the Southwest since 2006 (Table 14).
The impact of a pandemic on golf course nutrient use
The GCEP Nutrient Use and Management Practices on U.S. Golf Courses survey solicited data from years impacted by the COVID-19 pandemic. It was reported by 76% of facilities that nutrient use did not change because of the COVID-19 pandemic (data not presented).
Of the 15% and 9% of facilities that reported an increase or decrease, respectively, in applied nutrients resulting from the COVID-19 pandemic, 53% indicated the cause was due to more rounds played, followed by 29% reporting the cause was related
to budget (data not presented).
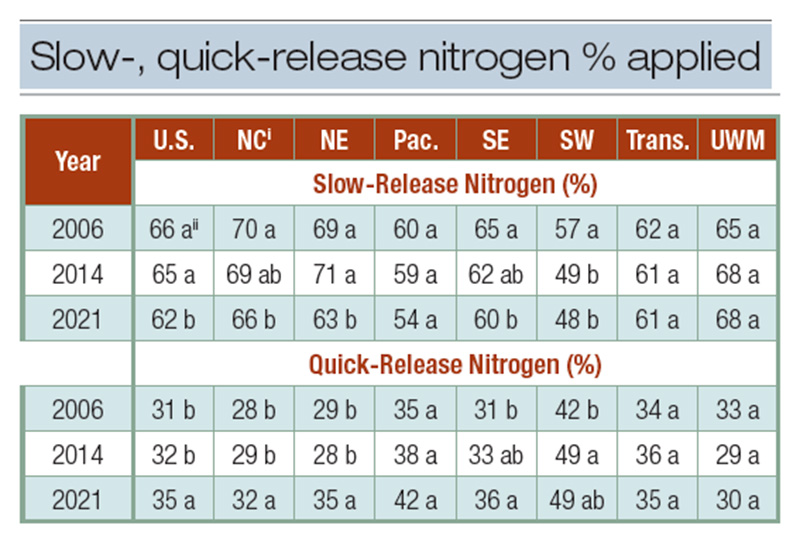
Table 11. Percentage of slow and quick-release nitrogen applied on U.S. golf facilities in 2006, 2014 and 2021. i NC, North Central; NE, Northeast; Pac., Pacific; SE, Southeast; SW, Southwest; Trans., Transition; UWM, Upper West/Mountain.
ii Within columns, values followed by a common letter are not significantly different according to the Tukey-Kramer test at the 10% significance level.
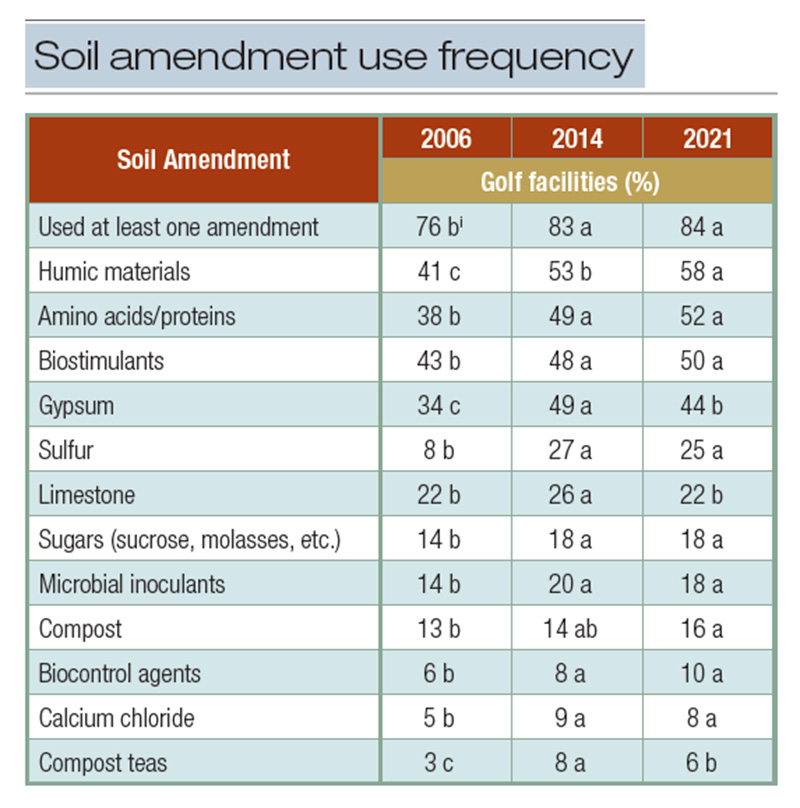
Table 12. Frequency of soil amendment and supplement use on U.S. golf courses in 2006, 2014, and 2021. i Within rows, values followed by a common letter are not significantly different according to the χ2 test at the 10% significance level.
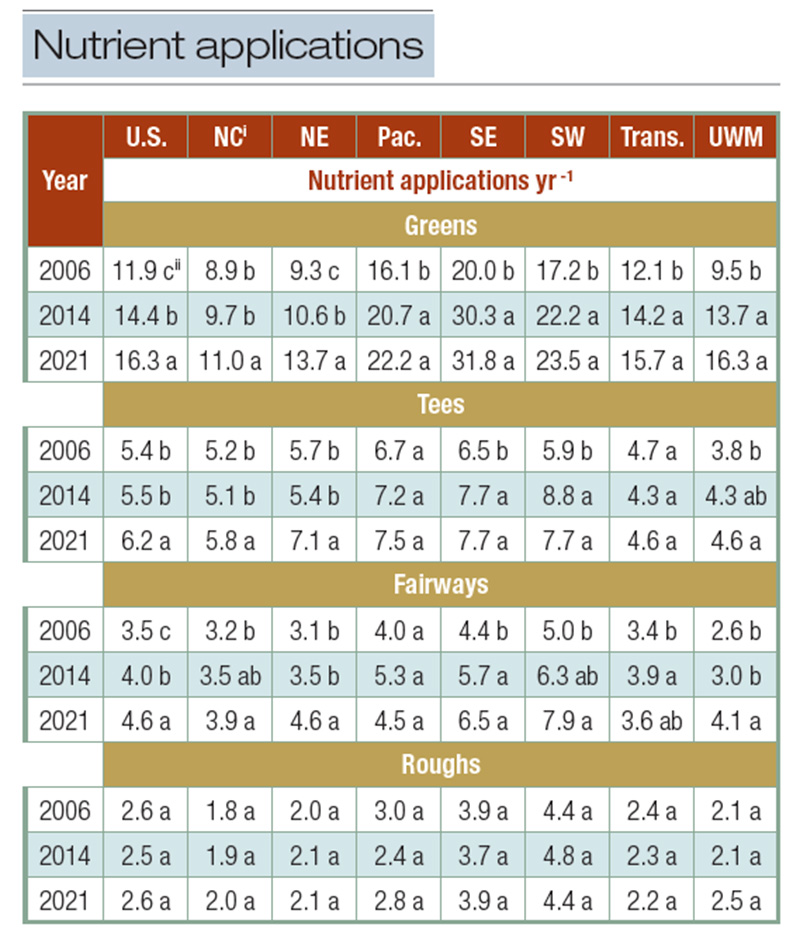
Table 13. Number of nutrient applications made annually on U.S. golf facilities in 2006, 2014 and 2021. i NC, North Central; NE, Northeast; Pac., Pacific; SE, Southeast; SW, Southwest; Trans., Transition; UWM, Upper West/Mountain.
ii Within columns, values followed by a common letter are not significantly different according to the Tukey-Kramer test at the 10% significance level.
Conclusions and recommendations
Significant reductions in nutrient use have occurred since the baseline survey in 2006. These reductions are a result of reduced application rates of nitrogen, phosphorus and potassium and fertilized acres.
The most significant nutrient reduction occurred with applied phosphorus and appears to be at least partially a result of mandated phosphorus restrictions, which was the most common restriction reported by facilities. Because phosphorus is an element
of potential environmental impairment, superintendents are encouraged to opt out of phosphorus application and reintroduce it only after a soil test or turfgrass response validates the need. Whether voluntary or mandated, this recommendation appears
to be followed by more facilities year-over-year as evidenced by the finding that more facilities did not apply any phosphorus in 2021 than in both 2014 and 2006.
Golf facilities interested in reducing fertilized acres may consider reducing fertilization of out-of-play roughs and natural areas, which may further contribute to an overall reduction of applied nutrients and potentially result in improved efficiencies,
reduced environmental risk and reduced maintenance costs.
Soil testing should result in a more efficient use of applied nutrients and remains a common nutrient management tool. It is an important factor when making nutrient application decisions. However, soil testing was the only management practice associated
with increases in applied nutrients. This association does not denote causality but should be investigated further to determine the cause more confidently and potentially refine the soil testing and application process. It is recommended that superintendents
contact their state’s land-grant university for accurate soil-testing information specific to turfgrass grown in their location.
It is recommended that facilities take the time to calibrate equipment prior to applications. Although this process may require additional time, the potential money savings and increased risk mitigation justifies the process. Similarly, it is recommended
that facilities continue to invest in infrastructure that allows for the proper fertilizer storage at their locations.
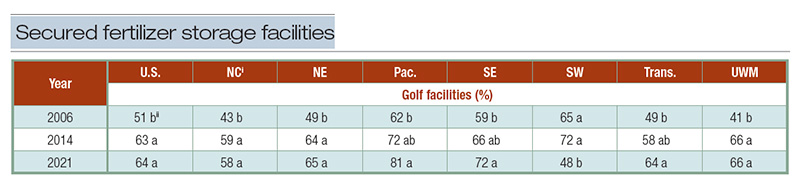
Table 14. Frequency of U.S. golf facilities that used fertilizer storage that, at a minimum, had an impervious floor and roof, ventilation, security (locked with access restricted), and containment features to prevent loss to the environment and/or contamination from run off in 2006, 2014 and 2021. i NC, North Central; NE, Northeast; Pac., Pacific; SE, Southeast; SW, Southwest; Trans., Transition; UWM, Upper West/Mountain.
ii Within columns, values followed by a common letter are not significantly different according to the χ2 test at the 10% significance level.
The Research Says
- Significant reductions in nutrient use have occurred since the inaugural baseline survey in 2006.
- Golf facilities interested in reducing fertilized acres may consider reducing fertilization of out-of-play roughs and natural areas.
- Soil testing should result in a more efficient use of applied nutrients and remains a common nutrient management tool.
- It is recommended that facilities take the time to calibrate equipment prior to applications.
- It is recommended that facilities continue to invest in infrastructure that allows for the proper fertilizer storage at their locations.
Funding
The third phase of the Golf Course Environmental Profile was conducted with funding provided by GCSAA.
Literature cited
- Association of American Plant Food Control Officials. 2017. Official publication. Association of American Plant Food Control Officials Inc., West Lafayette, Ind.
- Gelernter, W.D., L.J. Stowell, M.E. Johnson and C.D. Brown. 2016. Documenting trends in nutrient use and conservation practices on U.S. golf courses. Crop, Forage and Turfgrass Management 2(1):1-10 (https://doi.org/10.2134/cftm2015.0225) [accessed
1 Dec 2022].
- Golf Course Superintendents Association of America. 2021. Complete! Golf course environmental BMPs established for all 50 states. GCM magazine. https://www.gcmonline.com/course/environment/news/golf-course-state-bmps (accessed 1 Dec 2022).
- Index Mundi. 2022. Urea monthly price. https://www.indexmundi.com/commodities/?commodity=urea [accessed 1 Dec 2022].
- Shaddox, T.W., and J.B. Unruh. 2021. Determining nitrogen fertilizer cost using turfgrass response. HortTechnology 31(4):470-478 (https://doi.org/10.21273/HORTTECH04837-21).
- Shaddox, T.W., J.B. Unruh, M.E. Johnson, C.D. Brown and G. Stacey. 2022. Water use and management practices on U.S. golf courses. Crop Forage & Turfgrass Management 8:e20182 (https://doi.org/10.1002/cft2.20182).
J. Bryan Unruh, Ph.D., (jbu@ufl.edu) is a professor and associate center director at the University of Florida, Institute of Food and Agricultural Sciences’ West Florida Research and Education Center in Jay, Fla. Travis Shaddox, Ph.D., is president
of Bluegrass Art and Science LLC, Lexington, Ky.