Annual bluegrass (Poa annua L.) is often maintained as a component of or as the primary species of intensely maintained putting greens and fairways in many cool-humid climates. Prolific annual seed production gives annual bluegrass (AB) a unique
competitive advantage in turfgrass stands. A given population of AB is composed of different biotypes with divergent life strategies. Winter annual-type, colonizing, r-strategist biotypes termed Poa annua var. annua germinate in
the fall, flower in the spring and senesce in early summer. Perennial-type, competitive, K-strategist biotypes termed Poa annua var. reptans dominate over time in situations that favor continual growth, such as putting greens and
fairways. Perennial biotypes produce nondormant seed that flowers at maturity in the first year of growth. In subsequent years, vernalization synchronizes the flowering pattern to the spring (8). The result is that annual and perennial biotypes flower
in the spring. Gibeault (7), in California, found that annual biotypes produce more seed than perennial biotypes and completed flowering in 50 days compared to 81 days, respectively. AB flowers more abundantly at cooler temperatures and shorter photoperiods
(9).
The ability of AB to produce viable seed at greens and fairway height is unique among grasses. Golf course superintendents and especially golfers object to seedhead production of AB, as it results in a bumpy putting green and detracts from aesthetics.
More importantly, during seedhead production, plants divert a tremendous amount of energy from other plant processes, like rooting and production of defensive compounds, into flowering. In this way, heavy seed production during the spring may reduce
overall plant vigor, predisposing annual bluegrass to summer stresses such as heat, drought, disease and traffic. On putting greens or fairways where annual bluegrass dominates, suppressing seedhead production may be key to improving overall plant
vigor prior to summer stresses.
Understanding the onset, peak duration and completion of AB seedhead emergence is important to properly time cultural practices like clipping collection, preemergence herbicide application, cultivation practices and plant growth regulator seedhead suppression
treatments. Numerous examples of growing degree day (GDD) models have been developed for field and horticulture crops, insect development, and weed emergence and development.
Arnold (1) presented methods for determining the appropriateness of various base temperatures for use with simple average-calculated GDD models. This method was used (6) for determining the proper base temperature for a model to predict smooth crabgrass
(
Digitaria ischaemum) seedling emergence in Maryland. GDD was used (5) to predict AB seedhead emergence in Michigan. A base temperature of 13 C (55 F) was used to calculate GDD from April 1. In this model, GDD were calculated based on a method
proposed by Baskerville and Emin (2). The complicated math involved with this method has limited its use by turfgrass managers. Danneberger and Vargas reported that maximum seedhead production occurred over a 14-day period in May. Peak seedhead production
occurred between 363 and 433 GDD13. Danneberger and Vargas started GDD accumulation on April 1, as this date corresponded to snow-free turf being first present. In 2001, snow-free turf was present much earlier than April 1.
This research was conducted to 1) validate previously published GDD models for AB seedheads, 2) determine if a simple average-calculated GDD model could be used to predict AB seedheads, and 3) compare a simple average-calculated GDD model with the BE
calculated model.
Materials and methods
Seedhead emergence data of AB fairways were collected from three 47-inch-by-79-inch (1.2-meter-by-2.0-meter) plots at two sites in six one-year studies from 2001 to 2006 at the Hancock Turfgrass Research Center on the campus of Michigan State University
in East Lansing, Mich. Study sites were 9- to 15-year-old AB fairways maintained at .59 inches (1.50 centimeters), receiving .20- to .24-inch (0.51- to 0.61-centimeter) automatic irrigation throughout the growing season and 107 pounds nitrogen per
acre per year (120 kilograms nitrogen per hectare per year). Soil type was a Marlette sandy loam (fine-loamy, mixed, mesic Glossoboric Hapludalfs). Percent seedhead cover was determined by visual estimation for each plot throughout the seedhead production
period, which ranged from April 30 to June 17. Daily maximum and minimum air temperatures were collected by a Michigan Agricultural Weather Network weather station located approximately 3 miles (5 kilometers) from the study site. Two GDD methods were
calculated from March 1 using the weather station data.
Degree day accumulation for the simple average method was calculated as follows:
where T
m is the mean daily temperature (averaged over all readings), Tb is the base temperature, and n is the number of days elapsed since Feb. 28 (10). Research (4) found that modifying the start date from April 1, which was used by
the previously published method (5), to March 1 accurately predicted the optimum application range in all five years of research. Therefore, for this research, GDD calculations began on March 1 instead of April 1.
Seedhead emergence data did not differ by location and was pooled by observation date within a year prior to statistical analysis. Key seedhead emergence events (onset, peak duration and completion) were identified for each year.
Data for onset and peak flowering were used to select optimum base temperature with the method described by Arnold (1). He warned that base temperatures set too low would overestimate biological development, particularly as temperatures increase, while
base temperatures set too high would not be sensitive to biological development during cooler periods. Arnold concluded that base temperatures that are too high are often reported. Selecting a base temperature with the lowest coefficient of variation
in GDD should result in more reliable, repeatable accumulation of GDD from year to year. Seasonal and combined data were plotted against GDD as a continuous variable and analyzed for development of a simple average-calculated model and for comparison
with the previously reported model.
Results and discussion
Date and ordinal day values for onset, peak duration and completion of major flower production events for 2001-2006 are presented in Table 1.
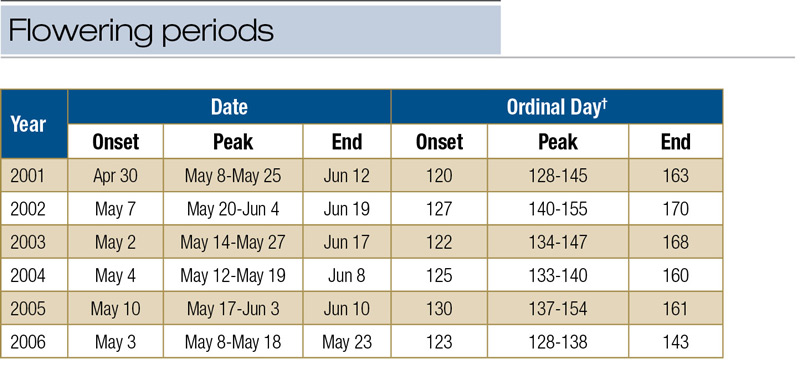
†Ordinal day calculated from Jan. 1. Values for 2004 reflect leap year.
Table 1. Date and ordinal day values that characterize the occurrence and duration of flowering period from 2001-2006 of an annual bluegrass fairway at the Hancock Turfgrass Research Center, East Lansing, Mich.
AB seedhead production occurred simultaneously at both locations in all years, but onset, peak duration and conclusion of flower production varied from year to year. On average, seedhead production occurred over a 40-day period between May 2 and June
10, with peak seedhead emergence occurring during a 14-day period between May 13 and 26. In all years, seedhead production was characterized by a rapid increase, a peak production period and a rapid decline (Figure 1).
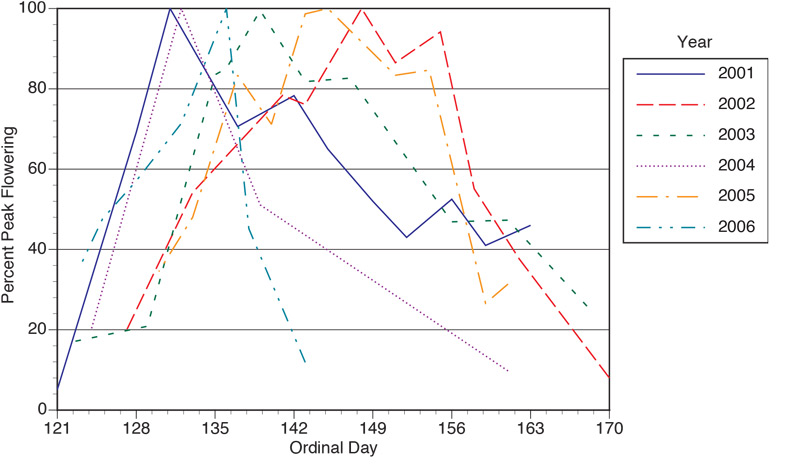
Figure 1. Fairway-height annual bluegrass (Poa
annua
var. reptans) seedhead production
from 2001-2006 plotted as percent of peak flower production versus ordinal day since Jan. 1.
Data from all six years were used to determine base temperature of the GDD model for predicting seedhead production rate of AB. On a year-by-year basis, growing degree-day totals calculated from average air temperatures collected approximately 3 miles
from the study site provided coefficients of determination ranging from R2=0.51 to 0.86 (the higher the R2 value, the better the GDD model predicts seedhead production). The base temperature we used was minus 5 C (23 F) because
it coincided with the lowest coefficient of variation (CV) for onset of seedhead production in GDD. This base temperature (23 F) is much lower than what has previously been used for AB. Bogart (3) reported that AB reinitiates growth at temperatures
above 13 C (55 F). Therefore, Danneberger and Vargas used 13 C in developing a seedhead model for AB.
Seedhead numbers increased rapidly from onset to peak production in all years. On average, onset, peak period and completion of flowering occurred at 550, 800 to 1,300, and 1,550 GDD-5, respectively (Figure 2). Flowering pattern of AB followed
a similar pattern for calendar date and GDD. Generated model equations were plotted against GDD for each year and are presented in Figure 3. The model provides a reasonable fit all years, except 2006, when major flower production lasted only 22 days.
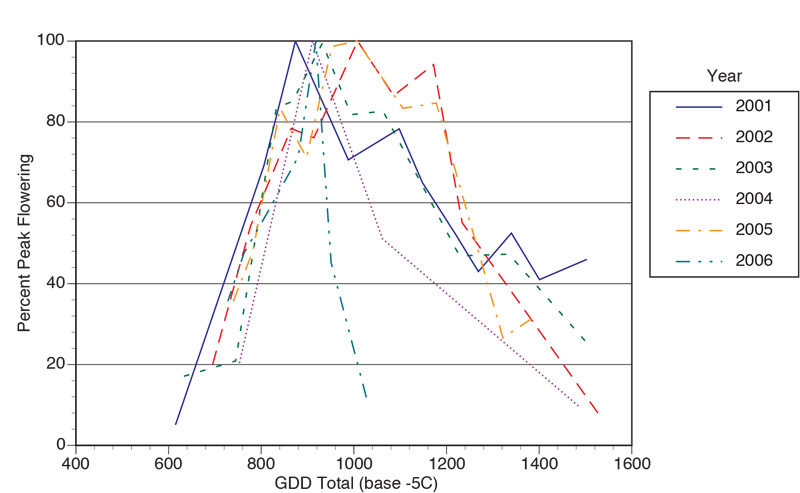
Figure 2. Annual bluegrass (Poa
annua
L.) seedhead
production from six years plotted as percent of peak flowering versus growing degree-day accumulation (base minus 5 C; 23 F) using simple average calculation method from March 1.
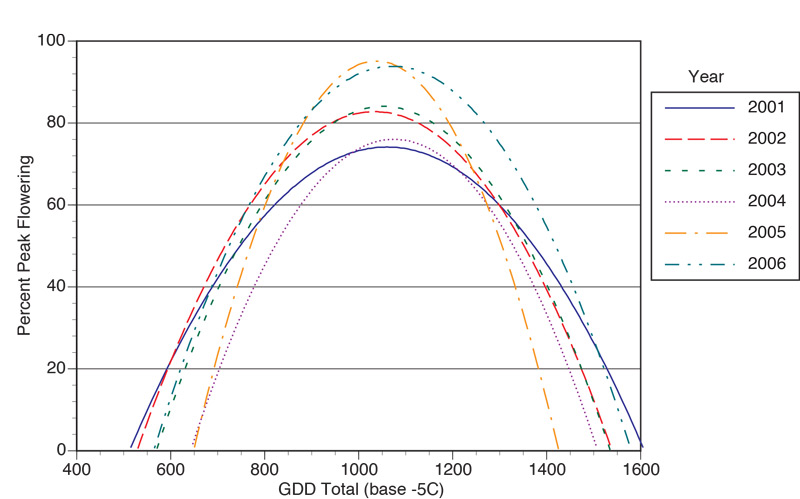
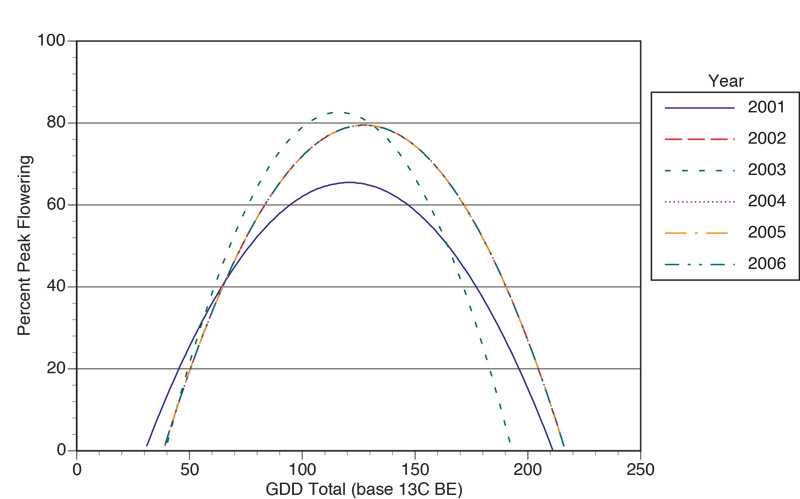
Figure 3. Predicted annual bluegrass (Poa
annua
L.) seedhead production from six years plotted against growing degree day accumulation (base minus 5 C; 23 F) using simple average calculation method from March 1.
On average, onset, peak duration and completion of flowering occurred at 50, 60 to 140, and 200 GDD13, respectively (Figure 4). The plot of percent of peak flower production against GDD13 does not have the same shape as when plotted
against ordinal day or GDD-5. With the higher base temperature, fewer GDD accumulate at or near the onset of flowering; however, warmer temperatures toward the end of May lead to more rapid GDD accumulation during and after the peak flowering
period, giving the appearance of a less rapid decline in seedheads. The nonsymmetrical shape of the GDD13 plot explains why Danneberger and Vargas used a third-order equation to describe seedhead number (R2=0.65). In their research,
quadratic and third-order models resulted in coefficients of determination of 0.45 and 0.65, respectively. However, their target range of 363 to 433 GDD13 did not coincide with onset, peak duration or conclusion of flower production in
the studies conducted between 2001 and 2006. Their observed peak seedhead period occurred between May 13 and 29. Peak flower production in 2001 to 2006 occurred during the same calendar dates but did not correspond with the target GDD range.
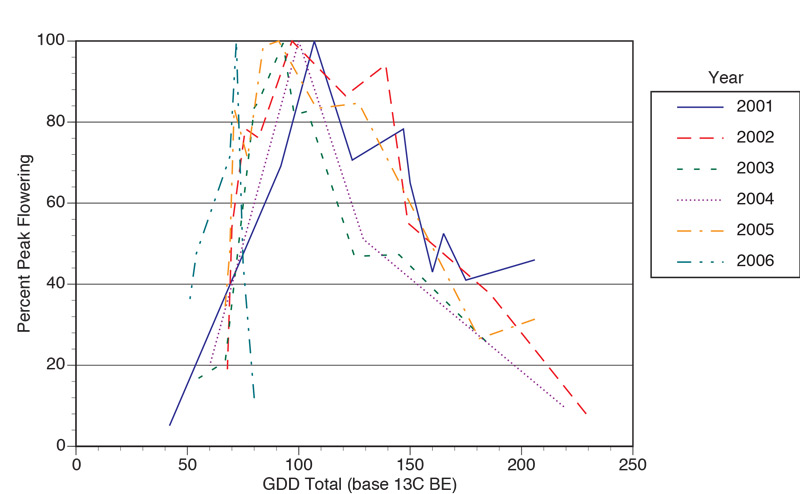
Figure 4. Annual bluegrass (Poa
annua
L.) seedhead production from six years plotted as percent of peak flowering versus growing degree day accumulation (base 13 C; 55 F) using Baskerville Emin method from March 1.
Figure
5. Predicted annual bluegrass (Poa annua L.) seedhead production from six years against growing degree day accumulation (base 13 C; 55 F) using Baskerville Emin method from March 1.
In 2001 to 2006, 363 to 433 GDD13 occurred, on average, July 1-9, nearly two months after peak flowering was observed. Generated quadratic model equations were plotted against GDD13 for each year and are presented in Figure 5. Using
a quadratic equation with GDD13 accurately predicts onset and conclusion of the flowering period. However, because the equation results in a symmetrical curve, the model underestimates occurrence of peak flower production in four of six
years. The quadratic model would not be appropriate for predicting peak flower period for GDD13. The use of a third-order model, like Danneberger and Vargas, is necessary with GDD13 to predict peak flowering period.
Conclusion
Occurrence and rate of flowering of AB were observed for six years in Michigan. GDD proved to be a reliable method to predict key flowering events in five of six years. Flowering pattern of AB followed a similar pattern for calendar date and GDD-5.
A set of quadratic models to explain AB flower production for ordinal day, GDD-5 and GDD13 provided coefficients of determination of 0.54, 0.65 and 0.45, respectively, over six years. Prediction with GDD13 was improved
by using a third-order model (R2=0.65). The additional term did not improve fit for ordinal day or GDD-5. Onset, peak period and completion of flowering were 550, 800 to 1,300, and 1,550 GDD-5, respectively. Peak flower
production of this AB population had previously been reported between 363 to 433 GDD13. However, in this research, peak flower production occurred between 60 to 140 GDD13 in all six years.
Determining least standard deviation in days for key developmental stages of AB flower production was useful in identifying a base temperature for use in simple average GDD calculations. Using the simple average GDD calculation method and a base temperature
of minus 5 C provided accurate estimation of onset, peak duration and conclusion of AB flower production. Calculating GDD from air temperature data collected from local weather stations could lead to the expanded use of GDD over broader geographical
regions. This research was the foundation for developing the models and website gddtracker.msu.edu that is used by many golf course superintendents in the northern US
to schedule PGR applications to suppress annual bluegrass seedhead production. Base temperatures, start dates and target ranges developed in Michigan may not be appropriate for other regions or climates, particularly where AB does not enter cold-temperature-induced
dormancy.
Acknowledgments
The authors wish to thank Michigan State University’s Project GREEEN and the Michigan Turfgrass Foundation for project funding.
The research says ...
- Growing degree days were reliable for predicting annual bluegrass flowering events.
- Simple average GDD calculations (base temperature: minus 5 C; 23 F) provided accurate estimates.
- Local weather stations can be used to calculate GDD effectively, which could expand GDD use.
Literature cited
- Arnold, C.Y. 1959. The determination and significance of the base temperature in a linear heat unit system. Journal of the American Society for Horticultural Science 74:430-445.
- Baskerville, G.L., and P. Emin. 1969. Rapid estimation of heat accumulation from maximum and minimum temperatures. Ecology 50(3):414-517 (https://doi.org/10.2307/1933912).
- Bogart, J.E. 1972. Factors influencing competition of annual bluegrass (Poa annua L.) within established turfgrass communities. M.S. thesis: Michigan State University, East Lansing, Mich.
- Calhoun, R.N. 2010. Growing degree-days as a method to characterize germination, flower pattern, and chemical flower suppression of a mature annual bluegrass [Poa annua var reptans (Hauskins) Timm] fairway in Michigan. Ph.D. dissertation:
Michigan State University.
- Danneberger, T.K., and J.M. Vargas Jr. 1984. Annual bluegrass seedhead emergence as predicted by degree-day accumulation. Agronomy Journal 76(5):756-758.
- Fidanza, M.A., P.H. Dernoeden and M. Zhang. 1996. Degree-days for predicting smooth crabgrass emergence in cool-season turfgrasses. Crop Science 36(4):990-996 (https://doi.org/10.2135/cropsci1996.0011183X0036000400029x).
- Gibeault, V.A. 1971. Perenniality in Poa annua L. Ph.D. dissertation, Oregon State University, Corvallis, Ore.
- Johnson, P.G., and D.B. White. 1997. Vernalization requirements among selected genotypes of annual bluegrass (Poa annua L.). Crop Science 37:1538-1542.
- Juhren, M., W. Noble and F.W. Went. 1957. The standardization of Poa annua as an indicator of smog concentrations. I. Effects of temperature, photoperiod and light intensity during growth of test-plants. Plant Physiology 32:576-586.
- Scott, S.J., R.A. Jones and W.A. Williams. 1984. Review of data analysis methods for seed germination. Crop Science 24(6):1192-1199 (https://doi.org/10.2135/cropsci1984.0011183X002400060043x).
Ronald N. Calhoun is area manager at Loveland Products Inc. in Loveland, Colo. Kevin W. Frank is a professor and turf Extension specialist in the Department of Plant, Soil and Microbial Sciences at Michigan State University. Aaron D. Hathaway is technical services manager at Nufarm, Howell, Mich.