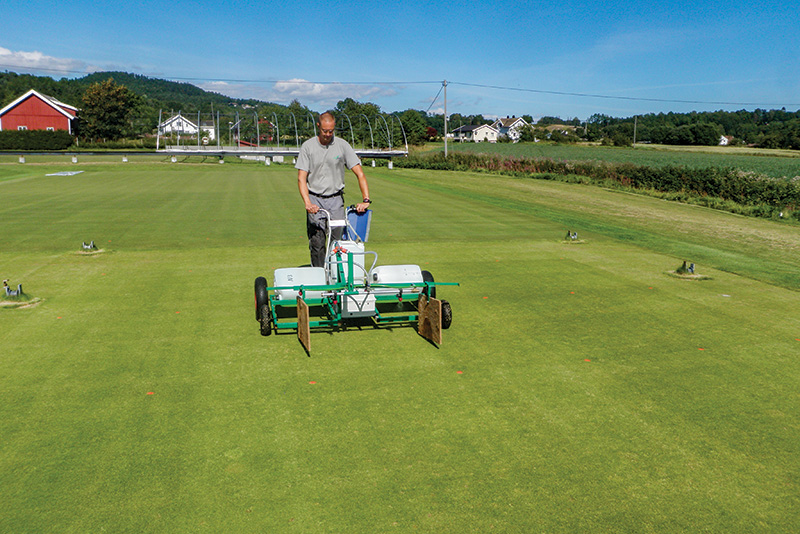
Weekly application of liquid fertilizer in strips at NIBIO Turfgrass Research Centre, Landvik, Grimstad, South Norway. Photo by Trygve S. Aamlid
About two-thirds of Norway’s 170 golf courses have putting greens seeded with red fescues (RF, Festuca rubra spp.). On most of these courses, seed of Chewings fescue (CF, F. rubra ssp. commutata) and slender creeping red fescue (SLCRF, F. rubra ssp. littoralis) have been mixed with seed of bentgrasses (usually colonial bentgrass, Agrostis capillaris), and in a few cases also with creeping bentgrass (Agrostis stolonifera) at a weight ratio of 90%-95% fescue and 5%-10% bentgrass (6). In Denmark and Sweden, there are some golf courses aiming for monocultures of red fescue, which — in the long run — may be easier to manage for consistent ball roll and firmness (7).
Because of fewer requirements for pesticides, fertilizer and irrigation, fescue-dominated putting greens are often considered as a more sustainable alternative to creeping bentgrass putting greens. However, that’s the case only if annual bluegrass (AB, Poa annua) can be controlled, which is a real challenge on many golf courses.
The most common methods to reduce AB contamination are withheld irrigation, increased mowing heights and a reduction in fertilizer inputs (2). Few researchers have investigated the effect of seasonal fertilizer distribution, which may also have an impact because RF and AB have different growth patterns and different susceptibility to disease during the season (13). For example, a reduction in nitrogen (N) inputs during the summer could perhaps make RF more competitive to AB, which often suffers from the low-N disease anthracnose (Colletotrichum cereale) at that time of the year. Thus, our objective was to determine the effects of different seasonal fertilizer distribution regimes on turfgrass quality, growth rate and invasion of AB on putting greens seeded with pure RF.
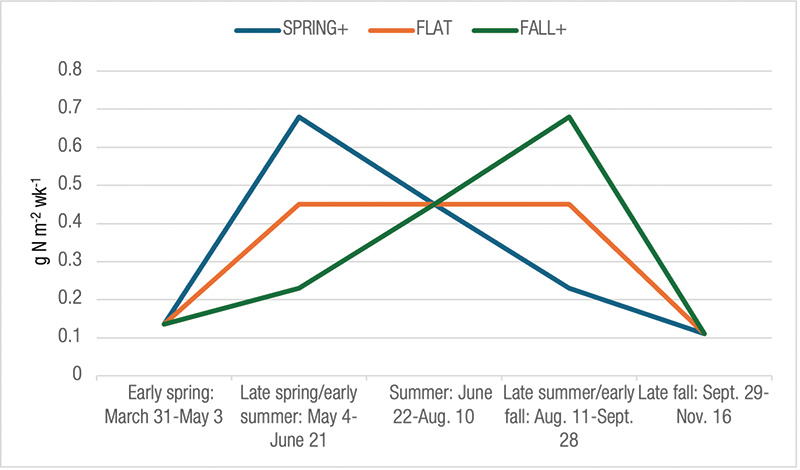
Figure 1. Illustration of the three fertilizer distribution treatments.
Materials and methods
A field trial was conducted from Aug. 12, 2013, to Aug. 9, 2015, on a putting green built using USGA recommendations (root zone ignition loss 0.9%, pH 6.2) under a movable rain shelter at NIBIO Turfgrass Research Centre, Landvik, Grimstad, South Norway (58°20’N, 8°32’E, 39.37 feet/12 meters above sea level). The experimental site has a moderate coastal climate with a monthly mean temperature ranging from 32.2 F (0.1 C) in January to 62.4 F (16.9 C) in July (annual mean 46 F/7.8 C) and an annual precipitation of 55.5 inches (140.9 centimeters) (reference period 1991-2020). The trial area had been established in September 2011 and, because of approximately 70% ice and water damage, reseeded in May 2013 with a mixture of 98% (w/w) red fescue (39.2% SLCRF Cezanne and 19.6% of each of the CF cultivars Bargreen, Musica and Calliope) and 2% unspecified seed of AB. The AB seed was included to create a uniform starting point for studies of competition between the two species.
From reseeding in May 2013 until the start of the trial on Aug. 12, 2013, a total of 0.50 ounces nitrogen per square yard (17 grams nitrogen per square meter) was applied to promote rapid recovery from the ice and water damage in spring.
The species composition at the start of the trial in August 2013 was visually assessed as 84% RF and 16% AB.
The trial was laid out according to a four-replicate strip plot design with irrigation in one direction and fertilizer distributions in the other direction.
This article will concentrate on the fertilizer distributions, as there were no significant interactions between the irrigation and fertilizer treatments, and the irrigation treatments have been reported previously (3).
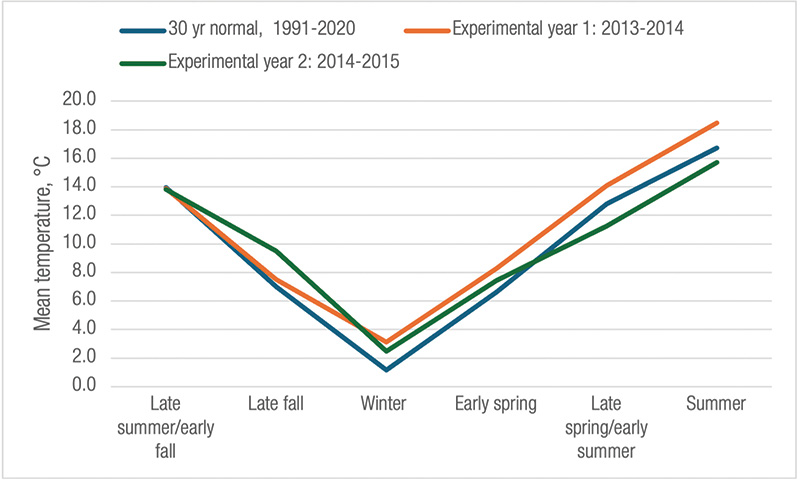
Figure 2. Mean temperatures for the periods late summer/early fall, late fall, early spring, late spring/early summer and summer in the two experimental years.
The test period was defined as two experimental years: Year 1 from Aug. 12, 2013, to Aug. 10, 2014, and Year 2 from Aug. 11, 2014, to Aug. 9, 2015. Each of the two experimental years was divided into five periods:
- Late summer/early fall (Aug. 11-Sept. 28).
- Late fall (Sept. 29-Nov. 16).
- Early spring (March 31-May 3).
- Late spring/early summer (May 4-June 21).
- Summer (June 22-Aug. 10).
Each period had a duration of seven weeks except for early spring, which was about five weeks depending on the start of the growing season.
The fertilizer inputs in late fall, early spring and summer were, in turn, 0.005, 0.005 and 0.013 ounces N per square yard (0.17, 0.17 and 0.45 grams per square meter) per week in all treatments, but the inputs in late spring/early summer and late summer/early fall varied among the following three treatments (Figure 1):
SPRING+: High N rates (0.02 ounces N per square yard/0.68 grams per square meter per week) in late spring/early summer; low N rates (0.007 ounces N per square yard/0.23 grams per square meter per week) in late summer/early fall.
FLAT: The same weekly rate (0.013 ounces N per square yard/0.45 grams per square meter per week) in both periods.
FALL+: Low N rates (0.007 ounces N per square yard/0.23 grams per square meter per week) late spring/early summer; high rates (0.02 ounces N per square yard/0.68 grams per square meter per week) in late summer/early fall.
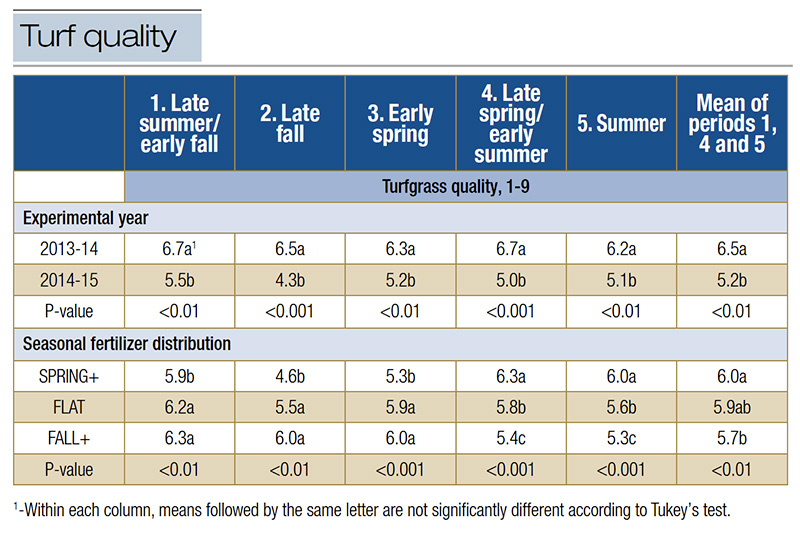
Table 1. Main effects of experimental year and seasonal fertilizer distribution on turf quality (1-9) during various periods.
Liquid fertilizer was applied every Monday as the complete fertilizer solution Wallco 5-1-4 with 60% of the N as NH4+ and 40% as NO3- (Cederroth International AB, Falun, Sweden). The fertilizer was applied in a carrier volume of 2.12 ounces per square yard (75 milliliters per square meter) using an experimental plot sprayer. The green was mowed at 0.2 inch (5 millimeters) using a single walk-behind mower three times a week.
Weather data and irrigation
After starting the experiment on Aug. 12, 2013, the mean temperature in the late summer/early fall and late fall periods of 2013 were both slightly higher than the 30-year normal values for the experimental site (Figure 2). The winter 2013-2014 was mild, with only 33 days of snow cover and no winter damage. The growing season in 2014 started in late March, and the temperatures in early spring and late spring/early summer and summer were, on average, 2.7 F (1.5 C) higher than the 30-year normal values. July 2014 was especially warm, with a monthly average of 67.28 F (19.6 C) and 16 days with the daily maximum higher than 77 F (25 C). The late summer/early fall in 2014 had temperatures about the same as in 2013, but the late fall was warmer in 2014. As in 2013-2014, the winter season in 2014-2015 was mild, with only a couple of weeks of snow and no winter damage. The growing season in 2015 started a few days later than in the year before, but still early compared with the 30-year normal. After that, temperatures in late spring/early summer and summer were low in comparison with the 30-year normal and especially when compared with 2014. Unlike in 2014, the daily maximum temperature never exceeded 73.4 F (23 C).
Irrigation was conducted one to three times per week (3). On average for irrigation treatments, the amount of irrigation water was 23.07 and 19.09 inches (586 and 485 millimeters) in 2013-2014 and 2014-2015, respectively. These values were close to the reference evapotranspiration of 23.46 and 20.71 inches (596 and 526 millimeters) as calculated by the Penman-Monteith equation (5).
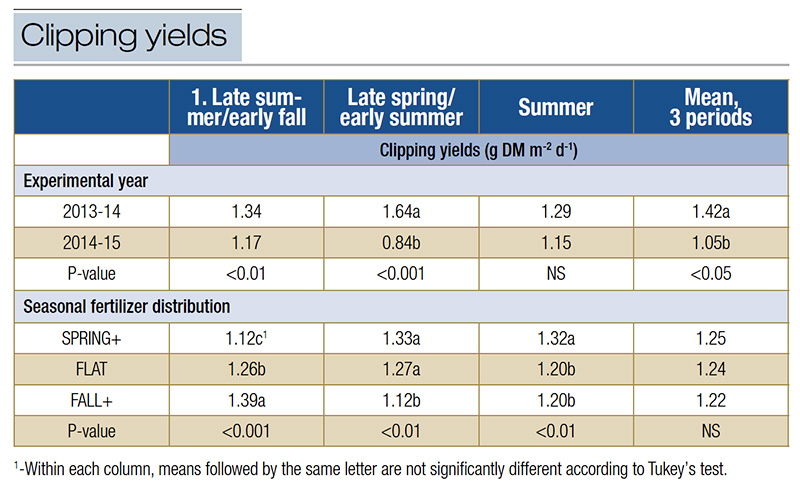
Table 2. Main effects of experimental year and seasonal fertilizer distribution on clipping yields in various periods.
Data collection
Turfgrass quality and percent coverage of AB were assessed visually every week on all plots from late March to mid-November. The rating scale for turfgrass quality was from 1 to 9, where 1 was the worst, 9 was the highest, and 5 was the lowest acceptable value.
Turfgrass clipping yields were measured every second Monday during late summer/early fall, late spring/early summer and summer in each experimental year. Clippings were collected from each plot on an area of 1.84 feet x 4.72 feet (0.56 meters x 1.44 meters) and dried for 48 hours at 140 F (60 C) before weighing. Root depth was measured with a ruler as the length of one intact hanging cylinder, 2.17 inches (56 millimeters) in diameter, taken from each plot by the end of the periods late summer/early fall, late spring/early summer and summer.
All collected data were analyzed using the SAS procedures PROC GLIMMIX (SAS Institute, Cary, N.C.). Tukey’s multiple comparison test at P≤0.05 was used to identify significant differences among treatments.
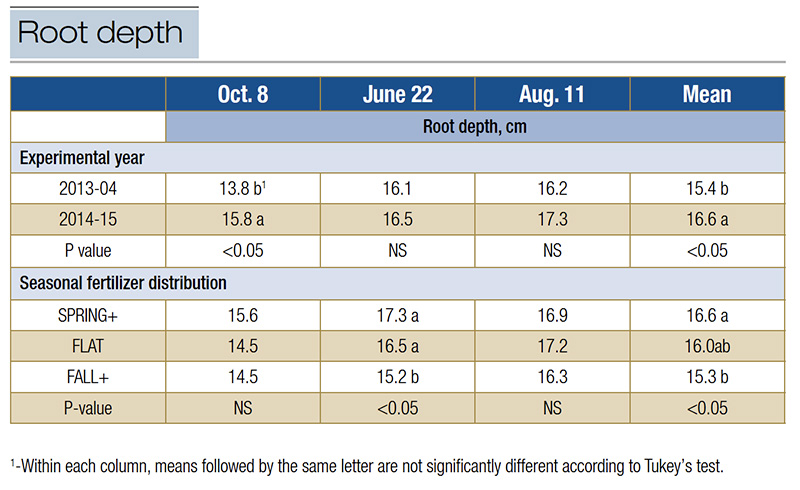
Table 3. Effects of fertilizer distribution treatments on turfgrass root depth measured as length of intact hanging cylinders.
Results
Turfgrass quality
During all seasonal periods, turfgrass quality was higher in 2013-2014 than in 2014-2015 (Table 1). In late summer/early fall, late fall and early spring, turfgrass quality was lower with SPRING+ fertilization than with FALL+ and FLAT fertilization (Table 1), but this was reversed during the late spring/early summer and summer periods, where SPRING+ fertilization produced higher quality than FLAT fertilization, which again produced higher quality than FALL+ fertilization. The latter ranking was reflected also in the mean values for late summer/early fall, late spring/early summer and summer, although the FLAT treatment was not different from the FALL+ or SPRING+ treatments on average for these periods.
Clipping yields
Clipping yields during late spring/early summer and on average for three seasons were higher in the first than in the second experimental year (Table 2). Clipping yields in the late summer/early fall were greater on plots receiving FALL+ fertilization, but this was reversed with most clippings in late spring/early summer and summer on plots receiving SPRING+ fertilization. During the unusually warm growing season in 2014, red fescue showed a bimodal growth pattern with peaks in mid-May and early August (data not shown).
Root depth
Root depth in October and on average for three dates increased from the first to the second experimental year (Table 3). SPRING+ fertilization resulted in deeper roots as measured by the end of the late spring/early summer period in late June and on average for measurements in October, June and August.
Annual bluegrass
As a main effect, AB contamination in late summer/early fall was more severe in the first year than in the second experimental year (Table 4). In late spring/early summer, summer and on average for three periods, this was opposite, with more AB in 2014-2015 than in 2013-2014. Differences between fertilizer treatments were absent in the first experimental year, but SPRING+ fertilization resulted in less AB than FALL+ fertilization in the second experimental year (Figure 3).
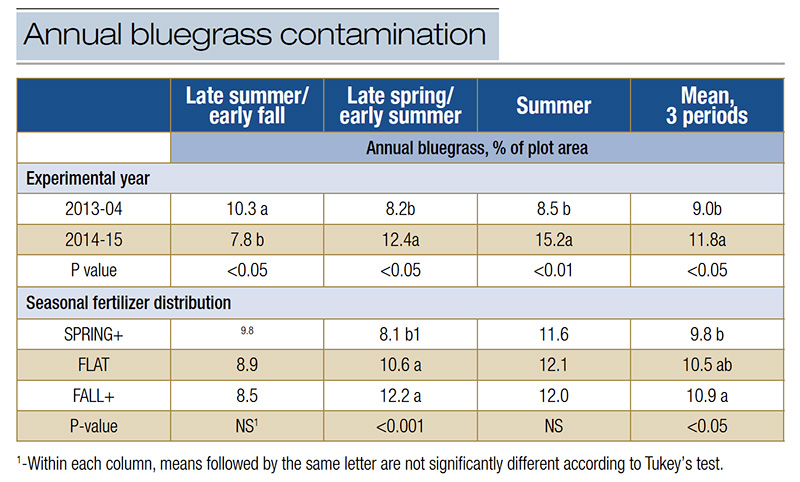
Table 4. Effects of fertilizer distribution treatments on annual bluegrass contamination as percent of plot area.
Discussion
Fertilizer distribution and the risk for red fescue summer stress
FALL+ fertilization resulted in higher visual turfgrass quality and enhanced growth rates not only in late summer/early fall, but also in the late fall and early spring periods of both experimental years. While this in agreement with Bauer et al. (1), there is always risk for N uptake efficiency to decrease and N leaching to increase with delayed N applications in the fall (9, 10).
According to old American literature, the rationale for late fall fertilization of cool-season grasses is to eliminate the need for spring fertilizer that can deplete carbohydrate reserves and limit root development before the start of heat or drought stress in summer (8, 11, 12). These recommendations are, however, based on experiences from areas with higher summer temperatures than in the Nordic countries. Our experiment was located at a latitude about 10 degrees north of the U.S.-Canadian border, and even in 2014, which had record-high temperatures in July, there was no indication that enhanced fertilization from the first week of May until mid-summer had any detrimental effect on red fescue summer stress tolerance. Under Nordic climate conditions and given the annual input of 0.15 to 0.44 ounces N per square yard (5 to 15 grams per square meter) that is usually recommended for fescue-dominated golf greens (7), we therefore conclude that there is little risk for incurring more summer stress by giving a higher portion of the total N input in late spring/early summer.
Annual bluegrass
Annual bluegrass invasion is the greatest threat to sustaining a fine-leaved fescue turf on putting greens. Since AB has a higher N requirement than other cool-season grasses (4) and no dormancy in the late fall and winter (13), it is not surprising that FALL+ fertilization resulted in the strongest increase in annual bluegrass coverage from the first to the second experimental year. Because of unusually high temperatures in the late fall of 2014 and a mild winter with no damage, the increase in annual bluegrass encroachment with FALL+ fertilization resulted in plants that competed more vegetatively and most likely produced more seedheads in the late spring/early summer of 2015.
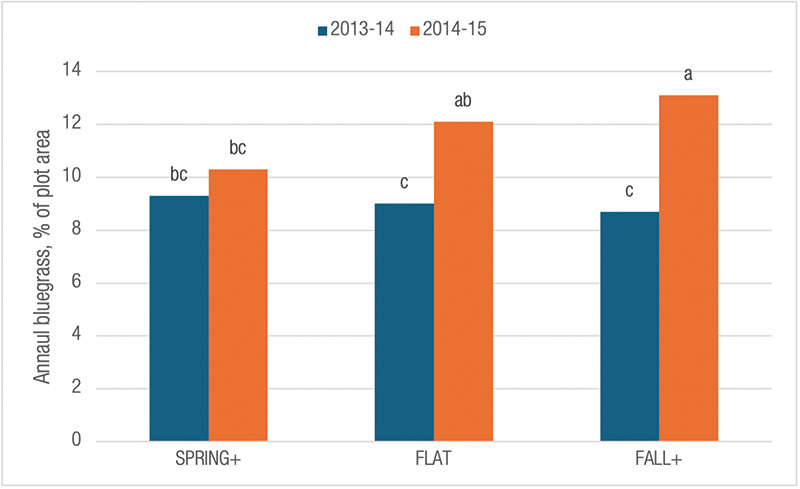
Figure 3. Annual bluegrass contamination as influenced by seasonal fertilizer distribution treatments on average for the first and second experimental year.
Conclusion
In summary, fertilizer costs and environmental concerns are currently putting pressure on golf course superintendents to optimize fertilizer inputs. Our results showed that SPRING+ fertilization, i.e. a skewed application regime with the highest inputs in May and June, resulted in higher turfgrass quality than the FLAT and FALL+ application regimes. SPRING+ fertilization also resulted in the least annual bluegrass contamination and the deepest roots, although the difference from FLAT was not significant for these characteristics. The only advantage of FALL+ fertilization was a faster green-up in April, but this was at the expense of more invasion from annual bluegrass, which has a lower temperature optimum for growth and therefore grows more vigorously in the late fall and early spring than red fescue.
The research says
- Our results showed that SPRING+ fertilization, i.e. a skewed application regime with the highest inputs in May and June, resulted in higher turfgrass quality than the FLAT and FALL+ application regimes.
- SPRING+ fertilization also resulted in the least annual bluegrass contamination and the deepest roots, although the difference from FLAT was not significant for these characteristics.
- The only advantage of FALL+ fertilization was a faster green-up in April, but this was at the expense of more invasion from annual bluegrass.
Acknowledgments
This research was funded by the Scandinavian Turfgrass and Environment Research Foundation. Thanks are extended to the National Natural Science Foundation of China (31372091) and the China Scholarship Council (CSC 201308230095) for funding Yajun Chen’s one-year sabbatical with the NIBIO Turfgrass Research Group.
Literature cited
- Bauer, S., D. Lloyd, B.P. Horgan and D.J. Soldat. 2012. Agronomic and physiological responses of cool-season turfgrass to fall-applied nitrogen. Crop Science 52:1-10 (https://doi.org/10.2135/cropsci2011.03.0124).
- Calvache, S., T. Espevig, T.E. Andersen, E. Joner, A. Kvalbein, T. Pettersen and T.S. Aamlid. 2017. Nitrogen, phosphorus, mowing height and arbuscular mycorrhiza effects on red fescue and mixed fescue-bentgrass putting greens. Crop Science 57:537-549 (https://doi.org/10.2135/cropsci2016.04.0240).
- Chen, Y., T. Pettersen, A. Kvalbein and T.S. Aamlid. 2017. Playing quality, growth rate, thatch accumulation and tolerance to moss and annual bluegrass invasion as influenced by irrigation strategies on red fescue putting greens. Journal of Agronomy and Crop Science 204:185-195 (https://doi.org/10.1111/jac.12246).
- Ericsson, T., K. Blombäck and A. Neumann. 2012. Demand-driven fertilization. Part I: Nitrogen productivity in four high-maintenance turf grass species. Acta Agriculturæ. Scandinavica, Section B - Soil and Plant Science 62: (Supplement), 113-121.
- Hess, T.M. 2009. Reference evapotranspiration program, WaSim software. Cranfield University, UK. 24 pp.
- Hesselsøe, K.J., P. Heltoft, T. Espevig and T.S. Aamlid. 2022. Seed mixtures of red fescue and colonial, creeping or velvet bentgrass for pesticide-free management of Nordic golf greens. International Turfgrass Society Research Journal 14:701-707 (https://doi.org/10.1002/its2.105).
- Kvalbein, A., A.M.D. Jensen, P. Rasmussen and T.S. Aamlid. 2012. Red fescue management. (http://sterf.org/library/handbooks/red-fescue-management) (accessed Jan. 4, 2024).
- Kussow, W.R. 1992. Late fall nitrogen fertilization. Proceedings of the 62nd Annual Michigan Turfgrass Conference 21:135-156.
- Lloyd, D.T., D. Soldat and J.C. Stier. 2011. Low-temperature nitrogen uptake and use of three cool-season turfgrasses under controlled environments. HortScience 46:1545-1549 (https://doi.org/10.21273/HORTSCI.46.11.1545).
- Mangiafico, S.S., and K. Guillard. 2006. Fall fertilization timing effects on nitrate leaching and turfgrass color and growth. Journal of Environmental Quality 35:163-171 (https://doi.org/10.2134/jeq2005.0061).
- Miltner, E. 2013. Fertilizing for the future: Superintendents simplify fall fertilization with control and slow-release fertilizers, producing green and healthy turf for the following season. Golfdom 69(9):26-30.
- Powell, A.J., R.E. Blaser and R.E. Schmidt. 1967. Physiological and color aspects of turfgrasses with fall and winter nitrogen. Agronomy Journal 59:303-307 (https://doi.org/10.2134/agronj1967.00021962005900040004x).
- Vargas, J.M. Jr., and A.J. Turgeon. 2004. Poa annua, physiology, culture, and control of annual bluegrass. John Wiley & Sons, Hoboken, N.J.
Trygve S. Aamlid (Trygve.Aamlid@nibio.no) is a research professor in the Division of Environment and Natural Resources and Trond Olav Pettersen is a senior engineer for Estates and Facilities at the Norwegian Institute for Bioeconomy Research (NIBIO) Turfgrass Research Group, Landvik Research Center, Norway. Yajun Chen, Ph.D., is a professor at the Horticultural College, Northeast Agricultural University, Harbin, Heilongjiang, China.