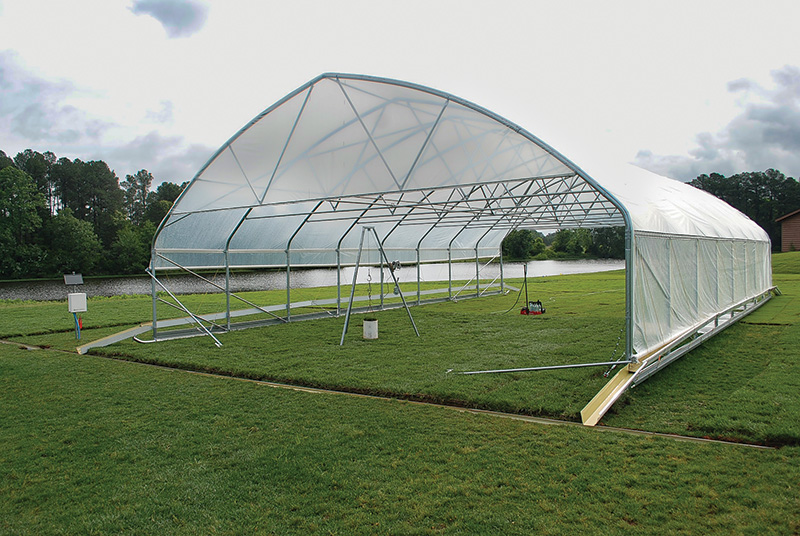
Three years of data were collected at the Lake Wheeler Turfgrass Field Laboratory in Raleigh, N.C., from June 2018 to September 2020. Photo by Grady Miller
Drought conditions in some parts of the country seem more common these days than ever. These often cause state and local governments to implement ordinances to limit or prohibit the use of irrigation water for various turfgrass areas. As water restrictions
become more common, or for those turfgrass managers who want to more efficiently manage irrigation, greater knowledge of turfgrass water needs is essential to maintaining healthy turfgrass stands with as little water as possible. By quantifying reference
evapotranspiration (ETo), water consumption can be estimated, and irrigation regimens can be modified to fit the plant’s water requirement. To improve irrigation scheduling, crop coefficients (Kc) have been utilized in conjunction with ETo to
calculate actual evapotranspiration (ETa) (1). Crop coefficients are the ratio used to define the difference in ETo and ETa. They may be developed based on month of the year, species and cultivar, among other variables (7). Crop coefficients are derived
directly from the plant’s response, therefore providing a useful tool in determining watering requirements for specific turfgrasses.
Since crop coefficients are determined during nonlimited conditions, they do not reflect the lower limits of water needs, while still maintaining turfgrass quality. Water stress coefficients (Ks) are derived under limited water conditions. The relation
between the drought stress coefficient (Ks) and ETa can be explained using the equation: ETa adjusted = Ks*Kc* ETo. If a plant conserves water during times of water stress, the interaction of ETa adjusted, ETo and Kc should provide a Ks value less
than 1. The deficit measured in ETa would represent the impact water stress had on ETa (1). Under no stress, ETa adjusted, ETo and Kc would balance out to provide a Ks value of ≥1.
Previous research found that bermudagrasses with lower ETa rates under drought stress had more available soil water at later stages of drought and remained green longer (9). Observations of bermudagrasses growing in an arid environment under drought stress
indicated that the turfgrass could maintain acceptable turfgrass quality with 20% to 28% reductions in Kc values (2). The use of drought-tolerant turfgrass cultivars is desirable due to greater water use efficiency and sustained acceptable turfgrass
quality during times of drought stress.
By utilizing Ks values, irrigation can be scheduled to ensure minimally acceptable turfgrass quality, using less water than needed based on ETo or ETo predictions with a Kc value (1). Considering the irrigation recommendation for warm-season turfgrass
in the transition zone is often 1 inch of irrigation per week in the absence of rainfall (4), a water-stressed turfgrass with a Ks of 0.75 could reduce the predicted water applications up to 25%. With a better understanding of turfgrass stress coefficients,
water purveyors and turfgrass managers can use Ks values to schedule irrigation while maintaining an acceptable level of turfgrass quality. To determine Ks values in the transition zone, four bermudagrass cultivars were subjected to intensive water
use measurements.
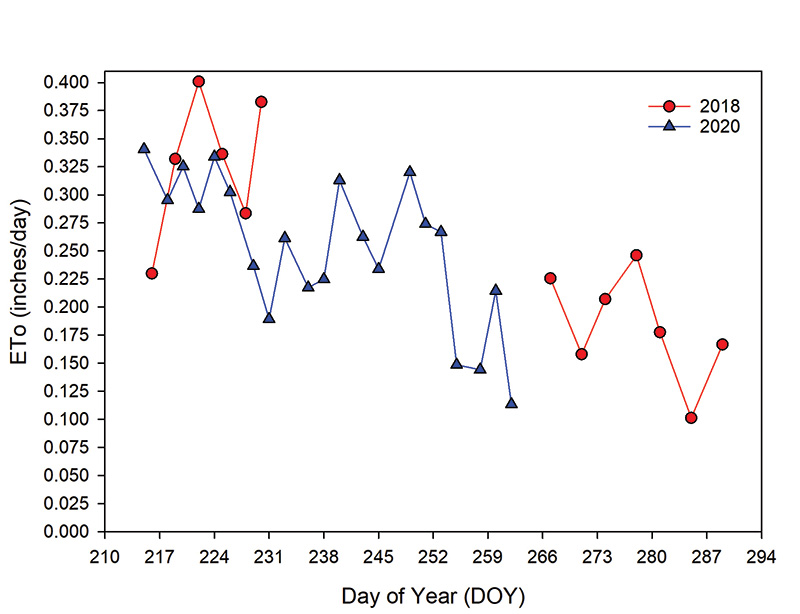
Figure 1. Reference evapotranspiration (ETo) values from days of the year in 2018 and 2020 in Raleigh, N.C.
Materials and methods
Lysimeters installed in the field were established with Latitude 36, Tifway and TifTuf hybrid bermudagrass (Cynodon dactylon x C. transvaalensis) and Celebration common bermudagrass (Cynodon dactylon) with three replications of each entry in a randomized
block design. Turfgrasses were established for six weeks in lysimeters prior to the start of the study to allow maturity before initiating water use measurements. Turfgrasses grown in the lysimeters and healthy stands of TifTuf surrounding the in-ground
lysimeters were clipped at a mowing height of 2 inches (5 centimeters) using a single-blade rotary mower with the clippings returned. The lysimeters were maintained under a portable rainout shelter covered with clear plastic that allowed 91% light
transmission.
Measurements of water loss were made three times weekly between 8 and 11 a.m. The dry-down period was initiated in late July and ended for cultivar groups once visible stress for an individual experimental unit was noted. Visible drought stress was defined
as the early stage of leaf wilting or any form of turfgrass canopy discoloration, which was generally a color change to bluish-gray. Once an experimental unit showed visible drought stress, its lysimeter weight was recorded and used as a baseline
weight going forward. The other two lysimeter weights within the cultivar group were recorded independently at this point to establish individual experimental unit baseline weights.
Water was added after each weighing interval to achieve baseline weights and to maintain minimally acceptable turfgrass quality. The difference in mass between the baseline weight and the weight of lysimeters during the next weighing interval equaled
actual evapotranspiration (ETa) for the days separating the two weighing intervals. This methodology resulted in each turfgrass being maintained under continual water-limiting conditions. With each experimental unit held under water-limited conditions,
any decrease in evapotranspiration was viewed as the cultivar’s ability to restrict ETa due to water stress. This limited ETa was considered adjusted evapotranspiration (ETa adjusted), or the decrease in ETa caused by water stress.
Weather data were measured and logged on 30-minute intervals with a weather station located under the rainout structure. Recorded data was used to calculate ETo per hour. Since all measurements other than the initial two weeks occurred under limited conditions,
monthly crop coefficients previously determined for bermudagrass at this location (6) were used in the ETa adjusted equation for determining Kc before calculating the Ks values.
Three years of data were collected at the Lake Wheeler Turfgrass Field Laboratory in Raleigh, N.C., dating from June 2018 to September 2020. Data points were utilized from only 2018 and 2020 due to the limited data points in 2019 following summer tropical
weather events. Data distributions were evaluated, and data means were subject to separation tests.
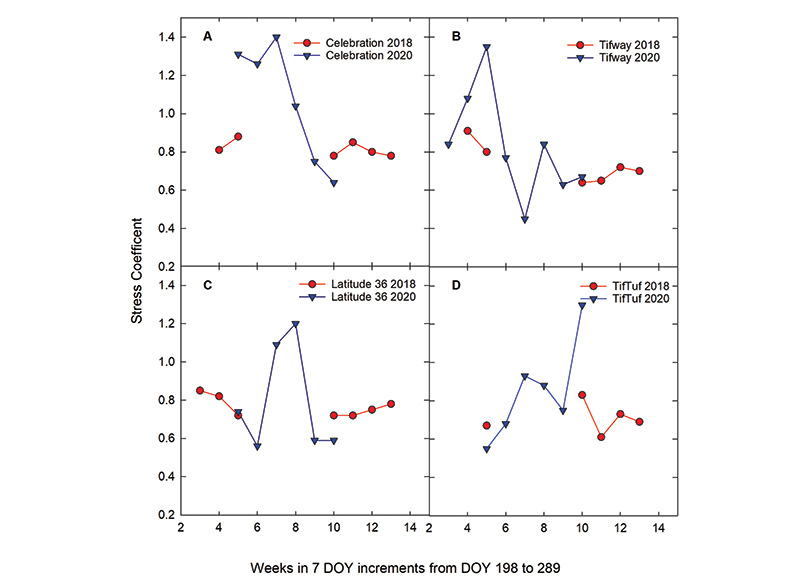
Figure 2. Calculated weekly stress coefficients during 2018 and 2020 for (A) Celebration, (B) Tifway, (C) Latitude 36 and (D) TifTuf bermudagrass grown in Raleigh, N.C. Each value represents a mean of seven days starting at day of year 198 and ending at day of year 289. In 2018 there is a gap in between Week 5 to Week 10 due to a tropical rain event that disrupted data collection.
Results
In 2018, the maximum ETo value of 0.401 inches (1.019 centimeters) per day, and the minimum ETo value was 0.101 inches (0.257 centimeters) per day, with an interquartile range of 0.154 (Figure 1). In 2020, the maximum value was 0.341 inches (0.866 centimeters)
per day, minimum value was 0.113 inches (0.287 centimeters) per day, and the interquartile range was 0.085. Greater variability was noted in 2018 compared to 2020, suggesting that variation in weather conditions played a role in turfgrass ETo. Visual
turfgrass quality ratings were recorded on two-week intervals in 2018 and 2020, with all rating means for all cultivars above the minimally accepted turfgrass quality rating.
Stress coefficient measurements for each cultivar were averaged by week using seven-day intervals between days of the year (DOY) 198 and ending at DOY 289 in 2018 and 2020, respectively, (Figure 2) to better illustrate variability over time. The cultivars’
ability to restrict water use and maintain turfgrass quality increases the plant’s drought resistance and may be important for selecting turfgrasses that persist during drought stress.
Stress coefficient differences were noted for cultivar and year, but there was no cultivar × year interaction. This indicated similar cultivar stress responses both years. Data were separated by weeks and year and presented in Figure 2 to better
illustrate Ks changes over time for each cultivar.
TifTuf, Latitude 36 and Tifway had similar mean Ks values at 0.747, 0.766 and 0.796, respectively. Celebration had a greater Ks value at 0.944. Previous research (2) reported that coefficient values measured under water stress in an arid environment were
between 0.57 and 0.64, whereas Kc values were expected to be ~0.80 under nonlimiting conditions. Their values (2) would be similar to the product of Kc times Ks values in our study, and result in calculated Ks values between 0.71 and 0.80.
The higher mean Ks value for Celebration indicates it was not as adaptive as the other cultivars in restricting ETa when experiencing water stress. This is further expressed in the interquartile ranges of the Ks values among cultivars. Tifway had the
lowest Ks interquartile range at 0.278. Latitude 36, TifTuf and Celebration had interquartile ranges of 0.304, 0.342 and 0.482, respectively. The greater quartile range in Celebration Ks data compared to the other cultivars suggests a more inconsistent
plant response to soil water compared to other cultivars (Figure 3).
The direct application of stress coefficients is to maximize water conservation with irrigation scheduling, while maintaining acceptable turfgrass quality. Data generated from this field study can be utilized as a tool for water purveyors to establish
baseline turfgrass water needs, which would maximize water conservation without sacrificing the many benefits turfgrasses provides. In other cases, Ks values could be a part of water conservation strategies during droughts or times of low water availability.
With aquifer depletion and overall water availability concerns, the ability to reduce irrigation while maintaining plant quality could be valuable in the future (3).
From strictly a golf course turf management perspective, total water applied to U.S. golf courses per unit area has declined by 25% between 2005 and 2022 (8). Sixty-eight percent of survey respondents indicated they are keeping turfgrass drier than in
the past. Survey results suggested that using more drought-tolerant turfgrasses is a significant factor in reduced water use and has become a central component of best management practices on golf courses (8).
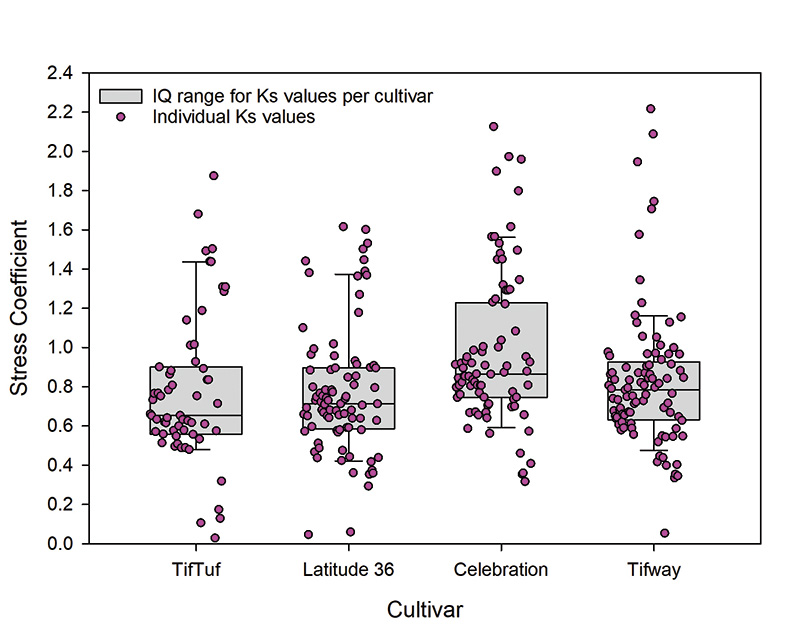
Figure 3. The interquartile range of Ks values for each bermudagrass cultivar grown in Raleigh, N.C., from data collected in 2018 and 2020. Each data point represents a calculated Ks value. Whiskers denote the 5th and 95th percentile of values.
Conclusion
To maintain turfgrass quality while using less water, it will become increasingly important to compare old and new germplasm under some type of drought screening. Stress coefficient values are a measure of the degree to which turfgrasses can restrict
their rate of transpiration, which can be useful for describing their drought adjustment capacity. Turfgrass requiring less water can result in cost savings through reduced irrigations, eliminating the need for replacement after droughts, and allowing
for greater sustainability (5). The results of this study indicate certain bermudagrass cultivars can maintain quality with less soil water, and the reduced water requirements may be used to schedule efficient irrigation applications. Stress coefficients
could be utilized as a quantitative measure of a cultivar’s drought tolerance, therefore providing turfgrass breeders with another tool to assess drought tolerance when evaluating germplasm. Techniques tested in this study are being further
utilized to evaluate Ks values of multiple turfgrass species and additional cultivars within those species.
The research says
- Turfgrass water use under drought stress can be measured beyond the often-used crop coefficient.
- TifTuf, Latitude 36 and Tifway were the best performing cultivars with mean Ks values of 0.747, 0.766, and 0.796, respectively. Celebration had the highest Ks value of 0.944.
- Budgeting irrigation with crop and stress coefficients can increase water use efficiency while maintaining minimally acceptable turf.
Acknowledgements
Data collection was largely shared by Cory Ketchum and Drew Pinnix.
Funding
This research was funded by the Center for Turfgrass Environmental Research & Education at North Carolina State University.
Literature cited
- Allen, R.G., L.S. Pereira, D. Raes and M. Smith. 1998. Crop evapotranspiration: Guidelines for computing crop water requirements. Irrigation And Drainage Paper 56, Food and Agriculture Organization of the United Nations, Rome.
- Garrot Jr., D.J., and C.F. Mancino. 1994. Consumptive water use of three intensively managed bermudagrasses growing under arid conditions. Crop Science 34(1):215-221 (https://doi.org/10.2135/cropsci1994.0011183X003400010039x).
- Konikow, L.F., and S.A. Leake. 2014. Depletion and capture: Revisiting “the source of water derived from wells.” Groundwater 52(21): 100-111 (https://doi.org/10.1111/gwat.12204).
- Miller, G. 2018. Lawns, Chapter 9. In: K.A. Moore and. L.K. Bradley (eds). North Carolina Extension Gardener Handbook. N.C. State Extension, Raleigh, N.C. (http://content.ces.ncsu.edu/9-lawns).
- Minor, J., B. Campbell, C. Waltz and J. Berning. 2020. Water savings and return on investment of a new drought resistant turfgrass. Journal of Environmental Horticulture 38(2):56-62 (https://doi.org/10.24266/0738-2898-38.2.56).
- Pinnix, G.D., and G.L. Miller. 2019. Crop coefficients for tall fescue and hybrid bermudagrass in the transition zone. Crop, Forage & Turfgrass Management 5(1):1-7 (https://doi.org/10.2134/cftm2019.02.0013).
- Romero, C.C., and M.D. Dukes. 2016. Review of turfgrass evapotranspiration and crop coefficients. Transactions of the ASABE 59(1):207-223 (https://abe.ufl.edu/faculty/mdukes/pdf/publications/NRES/nres11180_review-of-evapotranspiration-crop-coeff.pdf.)
- Shaddox, T.W., J.B. Unruh, M.E. Johnson, C.D. Brown and G. Stacey. 2022. Water use and management practices on U.S. golf courses. Crop, Forage & Turfgrass Management 8:e20182 (https://doi.org/10.1002/cft2.20182).
- Zhou, Y., C.J. Lambrides and S. Fukai. 2013. Drought resistance of bermudagrass (Cynodon spp.) ecotypes collected from different climatic zones. Environmental and Experimental Botany 85:22-29 (https://doi.org/10.1016/j.envexpbot.2012.07.008).
This research article is intended for educational purposes. Further comprehensive information can be accessed in our original publication in Crop, Forage & Turfgrass Management (https://doi.org/10.1002/cft2.20212).
Grady Miller, Ph.D., (grady_miller@ncsu.edu) is a professor, Extension turfgrass specialist and ENVU Distinguished Professor of Sustainability in the Crop and Soil Sciences Department at North Carolina State University, Raleigh.