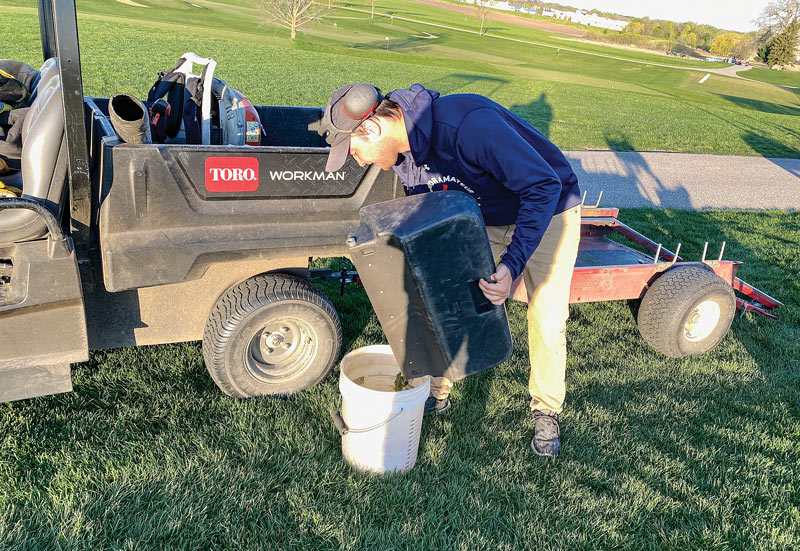
Insights gleaned from clipping volume can help guide maintenance decisions to optimize course conditions. Photo by Montana Pritchard
I first worked on a golf course in the summer of 1994 at my hometown course, Albany (Minn.) Golf Club. Even though that was more than 25 years ago, I still remember a lot about those days. I recall devouring issues of Golf Course Management while sitting on a mower eating my lunch. I also remember the club’s longtime golf course superintendent, Tom Kasner, asking the crew mowing greens, “How many greens between dumps?” and wondering what the heck he was talking about.
Eventually, I found out. As most of you probably know, Tom was asking that question because how frequently the baskets on the greens mowers needed to be dumped could give him an idea about how his maintenance practices were affecting the golf course. Were we mowing too much or not enough? Were the greens getting enough moisture or too much? Was the fertility plan on the mark, or were adjustments needed?
The 2020 golf season marked my 15th as a head superintendent. During that time, the approach I’ve taken to my job has evolved in many ways. I too was once firmly in the “How many dumps?” camp as a tool for assessing the health and playability of my golf course, but I’ve found a better way, and I’ll never go back. I’m now an evangelist for measuring clipping volume.
Measuring clipping volume from putting surfaces is quick, it’s easy, and it provides both short- and long-term feedback. It can broaden your knowledge of how your turf is responding to nitrogen, plant growth regulators, traffic, shade and all sorts of other inputs. If “How much grass did you get?” works for you, that’s completely understandable. I’m not looking to convince you otherwise. However, if you have been considering clipping volume but don’t know how to start or what to do with the numbers, keep reading. I’m going to try to answer some of your questions.
Getting started measuring turfgrass clipping volume
Here are a few things to consider if you’re interested in using clipping volume to measure your efforts.
Clipping volume is not a target
I’m going to mention this now, and then again at the end, because I think it’s very important. Clipping volume is not a target or a number you strive to hit every day. It’s a metric used for decision-making. Certainly, there will be a range you’ll want to target, but it’s not something you’re going to try to tune to a specific number every day.
Get a measuring vessel

At Hazeltine National Golf Club in Chaska, Minn., where author Chris Tritabaugh is superintendent, crews use 5-gallon buckets marked in liters to measure the clipping volumes from putting greens. Photo by Chris Tritabaugh
You will need some type of vessel that’s marked to show volume. We’ve purchased 5-gallon buckets from Amazon, but many options exist. If you’re not interested in purchasing, marking a vessel you already have works as well. You’ll only need to mark whole units. Our clippings are measured in liters, but if that sounds too international, measuring in quarts works too.
Know the area of your putting surfaces
Most turf managers will have this information readily available, likely in square feet. If you don’t already know the area of your putting surfaces, measurements can be made easily using Google Earth or Google Maps.
Editor’s note: Discover apps and other handy digital tools that make quick work of determining the area of greens in What the Tech? Easy ways to measure turfgrass area.
Define your unit of measurement
You’ll want to define the data you get from your clipping volume measurements in a unit that corrects for putting surface size. Volume over area will make this correction. For our clipping volume, for example, I’ve chosen the unit of milliliters per meter squared. Others use the unit of quarts per thousand square feet. Ultimately, you should use the unit that works best for you and makes the most sense to you.
I’ve chosen mL/m2 for two reasons. First, the corrected volume in this unit is a number between 0 and 100, eliminating the need for a decimal place and making everything look very clean in a table or chart. Second, many of the turf managers I know who collect this data use this unit of measurement, which makes comparing numbers with colleagues easy.
Identify a method for recording your data
Over my four seasons of collecting, I’ve used both Microsoft Excel and Google Sheets. I switched to Google for the purpose of easier data input and document sharing.
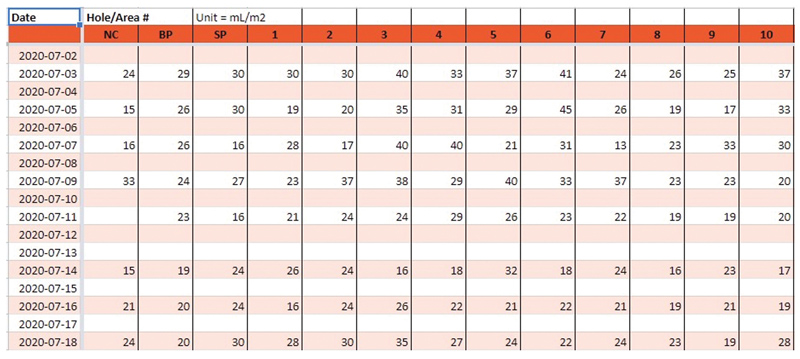
I have learned over the years that, when creating sheets to record the data, the simpler, the better. Basically, you want the date in the first column working downward, and then the volume from each area on that date going across in the subsequent columns. The next day’s data then gets recorded in the next row down (see Figure 1, below). Organizing your data in a similar fashion will also make things easy when you eventually want to create charts.

Figure 1. An example of recording data from clipping volume measurements. This table tracks the date of measurement vertically and the areas being measured horizontally. Click on the table to enlarge.
Have a plan for the process of clipping collection
Collecting clipping volume data will require some operational adjustments, and while they’re not major, you’ll need a plan to make sure you get good data day after day.
How many greens will you measure?
We measure all of ours and have found it to be no more time-consuming than measuring a smaller number of greens. Our operators have become familiar with the expected measurements of each green, so when something isn’t right, it’ll show up as too much or too little volume.
On more than one occasion, we’ve quickly identified an issue with a particular mower because the operator knew the measurement was abnormal. We’ve also been able to fine-tune the mowing technique of our operators based on variances in their measurements. The position of an operator’s hands or a simple lift of the handle has a big impact on volume, which translates directly to the consistency of the surface. If you choose to measure only a select few greens, you will still get useful data, but you’ll be less likely to catch equipment and operator variances.
How will the clippings be collected, and how will the data be reported?
Our operators dump the mower basket into the collection bucket, shake the clippings until they’re level, and then record the volume on their phone or a piece of paper (scorecards work great for recording). They send me that information by text or by dropping it at my door once they’ve finished their route. Our buckets are marked in 1-liter increments, and operators will record their volume to the 1/2 liter. We walk-mow our greens, so all clippings collected from a particular green are recorded, even when two mowers are mowing a single green. One note: We do not include the cleanup pass in our volume. The cleanup is always mowed by a separate mower, and thus this volume is not part of our data. We make no adjustment for surface areas due to this fact.
How often will you collect data?
I highly recommend that if you are going to collect clipping volume data, you do so every time the surfaces are mowed. I do not think this data is useful unless it’s collected every time the greens are mowed. Additionally, as you’ll notice in Figure 2 (below), I tend to focus on a seven-day moving average, which means that on days that you do not mow, the volume should be recorded as zero.

Figure 2. Each data point represents the average clipping volume in mL/m2 across all putting greens on a given day in July 2020. The seven-day average is represented by the solid blue line. Click on chart to enlarge.
What do the numbers say?
Once you’ve started to collect your data, you’re probably going to ask, “Now what?” My recommendation to colleagues has been that it will take some time for the data you collect to start making sense. You’ll also want to make some charts like the one in Figure 2. Charts like this help the turf manager visualize their clipping volume and begin to make sense of the data.
As time has gone by, our clipping volume numbers have started to tell a story. I’ll use charts like Figure 2, which shows data from July 2020, to explain what the numbers tell us. The numbers for each data point are the average mL/m2 across all putting greens on that day. Data points sitting at zero are days on which we did not mow. The solid line is the seven-day moving average, which, as time has gone on, has become the metric to which I pay the most attention. At Hazeltine, my goal is a seven-day average between 10 and 20 mL/m2.
Clipping volume FAQ
The topic of measuring clipping volume has been a popular one for turfgrass managers on social media, and I’ve been an active participant in more than my fair share of conversations on Twitter. So, when I was working on this article, I went to that same platform and asked others for their questions about measuring clipping volume. I got several good ones I thought I would address.
Avoiding overreactions
If you look at the averages from each mow, you will see a lot of fluctuations. That’s why I pay most attention to the seven-day average, because it reduces the extremes and takes into consideration the days on which we don’t mow. For this reason, the seven-day average is essentially telling me how much the grass grows each day. Figure 2 shows that while the volume for each mow jumps around, the seven-day average is relatively stable. Basing decisions on this metric will eliminate overreaction to any one day’s anomaly.
At Hazeltine, if the average during the growing season drops below 10, my first reaction is to reduce mowing frequency, letting the grass grow more between mows. Ideally, I prefer to roll every day and mow about every other day, with occasional days of back-to-back mowing. I would rather not mow more, nor would I want to mow less. If the seven-day average cannot stay between 10 and 20 with desired mowing frequency, my next adjustment would be to PGR rates/timing or nitrogen applications.
While this article is about clipping volume, I’d be remiss if I didn’t mention that daily Stimpmeter data has become a vital partner to our clipping volume measurements. I know that with a seven-day moving average between 10 and 20 mL/m2, we can get away mowing every other day, because I have the Stimpmeter data to tell me our green speed goals are still being met.
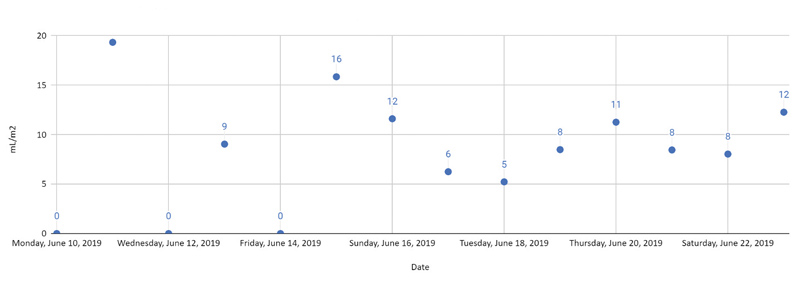
Some may be curious about how our tournament prep has affected clipping volume. While we were not measuring clipping volume during the 2016 Ryder Cup (anecdotally, it was very low on the “how-many-dumps” scale), we did measure it during the 2019 KPMG Women’s PGA Championship. Figure 3 (below) shows our clipping volume for advance and championship week.

Figure 3. This data was collected when Hazeltine National Golf Club hosted the 2019 KPMG Women’s PGA Championship, contested in June. Click on chart to enlarge.
By my recollection, everything from Sunday through Sunday was a double cut, so these volumes are quite low, but are perfect for short-term tournament conditions. However, my experience tells me that if we were to continue mowing each day with these kinds of averages, our surfaces would eventually deteriorate. Averages this low are not sustainable over the long term.
Interpreting the data
To show one way we use this data, I plotted data from 2017 and 2020 over the same period; 2017 is in orange, 2020 in blue (Figure 4, below). Concentrate on the seven-day average. In both seasons, the average was somewhat similar. However, there was a major difference in how this average was achieved.

Figure 4. A comparison of clipping volume data collected at Hazeltine National Golf Club in July 2020 (blue) vs. data from the same period in 2017 (orange). Click on chart to enlarge.
First, note that when we mowed in 2020, the volume was typically higher than in 2017. Now take note of the dots showing days of zero clipping volume (some of the days from 2017 are obscured). These are days we did not mow greens. There were 17 no-mow days in 2020, but only six in 2017. Unfortunately, I don’t have Stimpmeter data from 2017, but working from my own anecdotal evidence and recalling member comments from each year, the greens were faster, more consistent and had better surface quality in 2020. As time has gone by, the knowledge gained from our clipping volume has allowed us to fine-tune our programs, reducing mowing while improving surface quality and consistency.
Ultimately, clipping volume informs my short- and long-term decisions like this:
- Today: Are all the mowers performing properly? Did we have an operator with his hands in the wrong position?
- Tomorrow: Do we mow or not mow?
- Next week: How much nitrogen do we apply, and what should our PGR rates be?
- Next month and next year: Are we matching our performance from the past, or is an adjustment we made having the desired impact?
Having the information I shared in Figure 3 of clipping volume for KPMG week will help us replicate the conditions for future events, whether they’re member events or major championships.
Fertility implications
I don’t use a formula to decide on nitrogen rates, although I do track how much nitrogen is estimated to be harvested, based on the nitrogen content of bentgrass. Using the numbers and deciding how to adjust nitrogen and PGR rates is where the art of greenkeeping comes in. The data and the science inform, but feel plays its part as well.
Is dry weight worth the trouble?
Then, Auburn’s Beth Guertal, Ph.D., responded to Cutler’s tweet with this:
Both Cutler and Beth are right — dry weight would be the most accurate way to measure clipping volume. But as Cutler also noted, it’s impractical for a golf course maintenance operation like ours. Measuring volume the way we have chosen to do is far easier, and ultimately the data we collect is impacted very little by differences in moisture content.
Beth is also right that Micah Woods, Ph.D., has figures that correlate the volume and weight.
For the purposes of the golf course superintendent who wants to get quick, accurate information, though, volume is the most practical.
Ensuring accuracy
Concerns over accuracy are something I am often asked about. My answer is to be as accurate as possible, but don’t let perfect be the enemy of good. Different operators are going to get slightly different measurements, but small differences are not going to keep you from getting useful data.
As I input this data each day, if I see a green or an operator with a reported volume dramatically different from the rest, I’ll investigate. This could be equipment-related or operator-related. At the same time, when making forward-looking decisions, I’m really looking at the average across all greens, averaged again over the previous seven-day period. By the time all the averaging is complete, any anomalies coming from even a few inaccurate measurements are made mostly irrelevant.
Early in the article, I emphasized that these numbers are not a target. If you try to make clipping volume a daily target, you will become frustrated, and you will concentrate too much on the accuracy of individual measurements. Again, don’t let perfect be the enemy of good.
ROI from measuring clipping volume
For the past three years at the Golf Industry Show, I’ve had the great fortune of presenting “Successful Bentgrass Management” with Doug Soldat, Ph.D., from the University of Wisconsin in Madison. Last April, when the fate of northern golf courses during the COVID-19 pandemic was still up in the air, he wrote an article on the school’s turfgrass website — Measuring and managing clippings during the COVID-19 crisis — that offered advice for turfgrass managers who might need to reduce maintenance drastically. The article included the following comments from Doug on measuring clipping volume:
“I am still waiting to meet a golf course manager that started collecting clippings and then stopped because they felt it wasn’t worth the effort. The only difference between measuring clipping volume and measuring soil moisture is that measuring clipping volume is faster and less expensive than measuring soil moisture.”
Measuring and recording your clipping volume is quick and easy and produces a metric that will help inform your decisions over the short, medium and long term. I am confident you will gain knowledge about your turf and realize improved quality and consistency on your putting surfaces. I agree with Doug — I am confident that if you start, you won’t stop.
Chris Tritabaugh is the GCSAA Class A superintendent at Hazeltine National Golf Club in Chaska, Minn., and a 21-year member of the association.