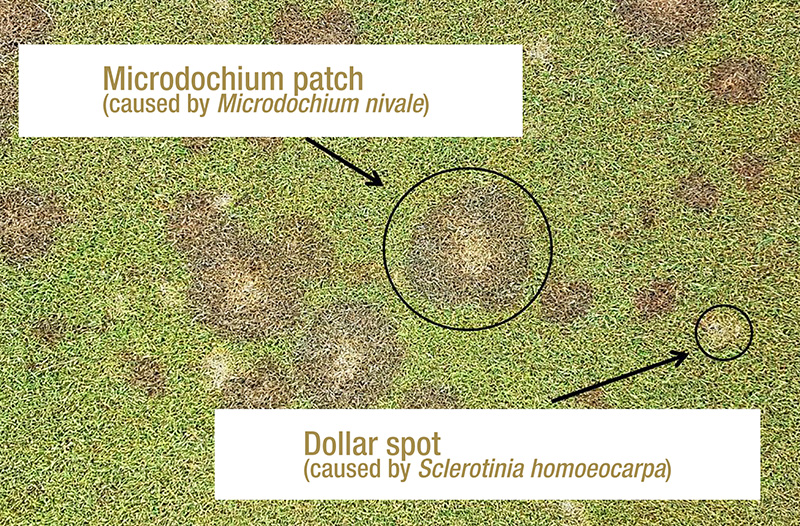
Figure 1. Microdochium patch symptoms alongside dollar spot symptoms on creeping bentgrass at the Guelph Turfgrass Institute in Guelph, Ontario. Photos by Ryan Gourlie.
Microdochium patch and pink snow mold are both caused by the fungal plant pathogen Microdochium nivale. In consistently cool, wet-temperate climates like those found in the coastal Pacific Northwest, M. nivale can cause severe damage
if left untreated (1) (Figure 1). The primary method of disease control for intensively managed turfgrass is the application of preventative and curative fungicides, which creates a strong selection pressure for a pathogen to evolve decreased sensitivity
to the fungicide families applied. This is analogous to the problem of antibiotic resistance in the medical field, where repeated or improper use leads to resistance. The development of fungicide resistance is a well-documented phenomenon, and resistance
to the demethylation-inhibiting (DMI) class of fungicides has been reported in over 40 plant pathogens, with 28 of those species having confirmed field resistance (2). The DMIs are a subgroup of sterol biosynthesis inhibitors (SBIs), which disrupt
the ability of fungi to produce a compound called ergosterol, an essential component of cell membranes. Since 1994, when a DMI was first registered for use on turfgrass in Canada, these fungicides have been widely used for the control of various fungal
pathogens, including M. nivale. Currently, DMI fungicides used against M. nivale include: propiconazole, difenoconazole, metconazole, myclobutanil, tebuconazole and triticonazole.
In our research, we found that some isolates collected from Victoria, British Columbia (BC), on the southwest coast of Canada were found to be resistant to the dicarboximide fungicide iprodione (3). Turfgrass managers from that same region anecdotally
reported decreasing efficacy of DMI fungicides for the control of Microdochium patch and pink snow mold. The reduced efficacy manifested as a reduced interval of control, meaning that a greater frequency of applications was needed to achieve previous
control levels. Since the region’s climate (cool and wet) is favorable for growth of M. nivale, turfgrass managers tend to use more frequent applications of fungicides annually (including propiconazole) relative to managers in other
regions, such as around the Great Lakes. The differences in fungicide use combined with the anecdotal reports created a good opportunity to assess whether resistance to propiconazole had developed in M. nivale from the Pacific Northwest coastal
area compared to the Great Lakes region.
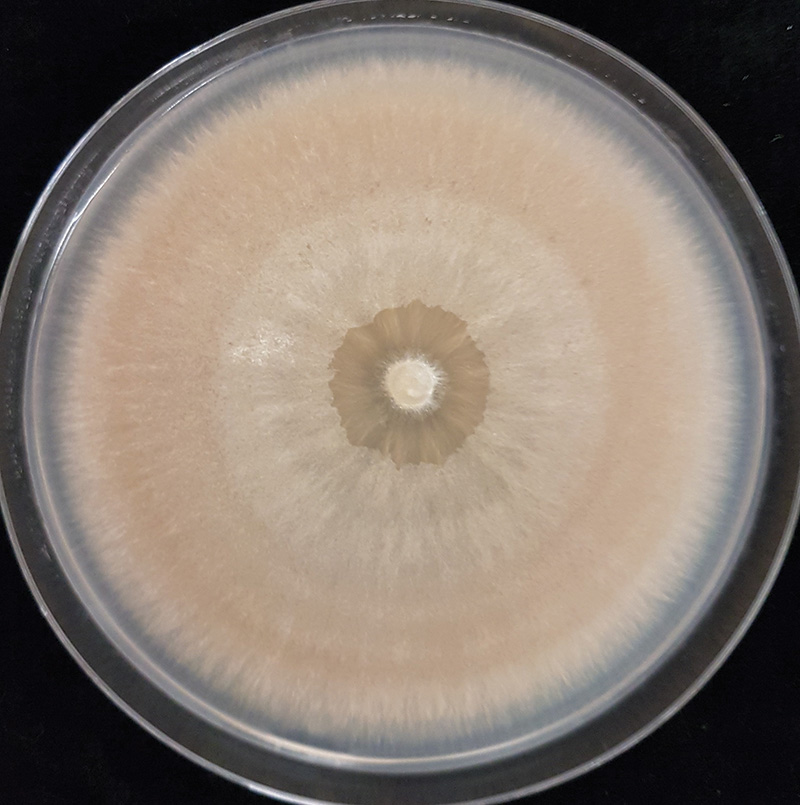
Figure 2. A culture of Microdochium nivale isolated from a diseased turfgrass sample.
Methods and materials
Sample collection, fungal isolation and storage of cultures
A total of 138 isolates was obtained from samples collected in 2016 and 2017 specifically for this study. Among these, 67 samples were collected from four golf courses near Guelph, Ontario, and 71 from four locations in southwestern British Columbia.
For the British Columbia locations, two were golf courses and one a private condominium complex practice green, all in Victoria. The fourth British Columbia location was a golf course in Vancouver. Samples were taken from various greens and fairways
with at least 3 feet (1 meter) between sample patches. An additional 114 isolates that had been collected across Ontario for previous studies and preserved at minus 4 F (minus 20 C) were revived from storage for inclusion in the sensitivity testing.
Most isolates were isolated from creeping bentgrass (Agrostis stolonifera) and annual bluegrass (Poa annua).
The grass samples we collected were kept at 39.2 F (4.0 C) and processed within two weeks of collection. Once in the lab, each sample went through an isolation process to separate the fungal pathogen from the plant host. Isolation involves sterilizing
the surface of the plant material (ethanol and diluted bleach) to remove or kill unwanted organisms and then placing the leaf onto a growth medium suitable for fungi. Because the pathogen is inside the plant tissue, it escapes the surface sterilization
and can grow out onto the medium. We used potato dextrose agar (PDA) amended with the antibiotics streptomycin sulfate and tetracycline hydrochloride to inhibit bacteria. Once the fungus had grown sufficiently, it was visually compared to known M. nivale cultures, which are distinctly pink-orange (Figure 2). A single isolate was retained per sample.
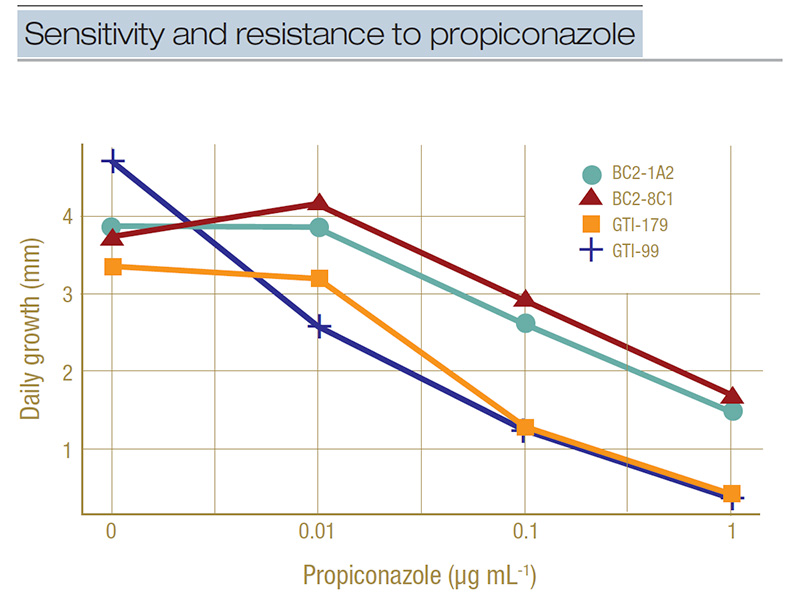
Figure 3. Example of dose-response curves for select isolates representing sensitivity (GTI-179 and GTI-99) and resistance (BC1-1A2 and BC2-8C1) to propiconazole. Daily growth rate in millimeters is shown for the four concentrations of propiconazole used in the full concentration range testing (0, 0.01, 0.1, and 1 microgram per milliliter). A separation between the groups can be seen at the 0.1-micrograms-per-milliliter concentration.
Sensitivity testing overview
Propiconazole can be expected to inhibit the growth rate of sensitive fungal isolates, with increasing concentrations resulting in higher inhibition. If we measure these growth rates on media containing different amounts of the fungicide, we could expect
resistant isolates to stand out, being affected less than the more sensitive isolates and able to grow on higher concentrations. Sensitivity testing enables us not only to identify emerging resistance, but also to describe just how much any one resistant
isolate differs from the average sensitive isolate (resistance factor).
Two types of tests were performed — a full concentration range test and a discriminatory concentration test. In the first, we examined how quickly isolates grew on increasing concentrations of propiconazole. A subset of isolates from Ontario or
British Columbia was chosen to undergo this full-range testing. The results of the first round allowed us to determine a concentration at which resistant isolates grow to an observable size, while sensitive isolates are mostly inhibited. The dose
at which we saw this separation was called the “discriminatory concentration,” and it allowed us to reduce the amount of labor and materials. We tested all 252 isolates with the discriminatory concentration.
Full concentration range details
Propiconazole (Banner Maxx, Syngenta) was added to PDA to obtain four concentrations: 0, 0.01, 0.1 and 1 microgram per milliliter (these units are equivalent to parts per million) by diluting propiconazole in acetone before mixing with molten PDA. The
mixtures were poured into 3.54-inch-diameter (9-centimeter-diameter) petri plates, at .42 ounces (12.0 milliliters) per plate and allowed to set. The media was then cut using six blades mounted on a 3.54-inch-diameter aluminum holder, and excess agar
was removed, leaving three .39-inch-wide (1.0-centimeter-wide) agar strips in each plate (4). This strip agar assay allowed for three isolates to be tested per plate, which is another labor- and material-saving measure. Agar plugs, 0.2 inches (5.0
millimeters) in diameter, were taken from the growing edge of active mycelia and placed hyphal side down on the middle of the agar strips. The plates were incubated at 68 F (20 C), and radial growth measurements were taken at 48 and 96 hours post
plating. Fifty isolates from British Columbia and 47 from Ontario were included in this experiment, and it was repeated three times.
The level of sensitivity to a compound such as propiconazole is described by something called the EC50 value, which stands for the effective concentration at which growth is reduced by 50%. Each isolate has its own EC50 value (measured in micrograms per
milliliter). Resistance Factor (RF) calculations can be performed for any isolate by taking its EC50 value and dividing it by the average EC50 value of the sensitive isolates. The growth data from each concentration were analyzed with the statistical
software protocol SAS using the PROBIT procedure. Probit transformation is used to smooth dose-response curves, allowing for a better estimation of EC50 values (5).
Concentration details
Each of the 252 isolates was grown on plates of propiconazole-amended media in only two concentrations: the discriminatory concentration of 0.1 micrograms per milliliter propiconazole and 0 micrograms per milliliter for a baseline comparison. We calculated
a percentage of inhibition on the discriminatory concentration by dividing the growth rate on 0.1 micrograms per milliliter by the growth rate on 0 micrograms per milliliter and multiplying by 100. If an isolate retained a daily growth rate on the
propiconazole-amended medium equal to or greater than 50% relative to the baseline non-amended medium, it was deemed resistant. If its growth was reduced to less than 50% of baseline, it was deemed sensitive. The inhibition data were subjected to
ANOVA using SAS proc GLM. The means were then separated by Fisher’s protected LSD (p=0.05). These are statistical methods used to assess how significant the differences are between the sensitive and resistant groups. The discriminatory testing
was repeated twice for each isolate.
Results
The full concentration range sensitivity tests revealed the EC50 values ranged between <0.001 to 0.89 micrograms per milliliter for the 47 Ontario isolates, with the resistant isolates having an average EC50 of 0.34 micrograms per milliliter and an
RF of 7.9. In comparison, the 50 British Columbia isolates had EC50 values from 0.02 to 8.7 micrograms per milliliter, with resistant isolates having an average EC50 of 0.79 micrograms per milliliter and an RF of 20.8. The higher EC50 values found
in the British Columbia isolates meant that it takes higher concentrations of propiconazole to achieve the same amount of growth inhibition. As we mentioned in the methods section, the results of this first set of experiments allowed us to determine
a discriminatory concentration. The dose-response curve in Figure 3 illustrates how we did this. This figure shows the growth rate in millimeters per day of two sensitive isolates (GTI-179 and GTI-99) and two resistant isolates (BC2-1A2 and BC2-8C1)
on four concentrations of propiconazole (which is plotted on a log-scale to make the line easier to interpret). We can see at the 0.1-micrograms-per-milliliter concentration there is a separation of the lines, with the lower two being the sensitive
isolates growing less than 50% their normal rate (0 micrograms per milliliter in the graph) and the higher two isolates being the resistant ones growing more than 50% their normal rate. This is how we set the discriminatory concentration to 0.1 micrograms
per milliliter.
When we tested all the isolates on the discriminatory concentration, we found that 24% of the Ontario isolates were resistant to propiconazole, compared to 77% of isolates from British Columbia. Additionally, when we ran the statistical tests with the
British Columbia isolates treated as one group and the Ontario isolates as another, there was a statistically significant (p<0.05) higher proportion of propiconazole-resistant isolates in British Columbia relative to Ontario (Figure 4). This type
of statistic takes into account the different number of isolates tested from Ontario and British Columbia. Under propiconazole-free conditions, the mean growth rate of these two populations did not vary significantly, with British Columbia isolates
growing on unamended media at .256 inches per day versus .264 inches per day (6.5 millimeters per day versus 6.7 millimeters per day) for Ontario isolates. If the growth rates on the 0-micrograms-per-milliliter baseline differed between the two sets
of isolates, we would have needed to run other tests.
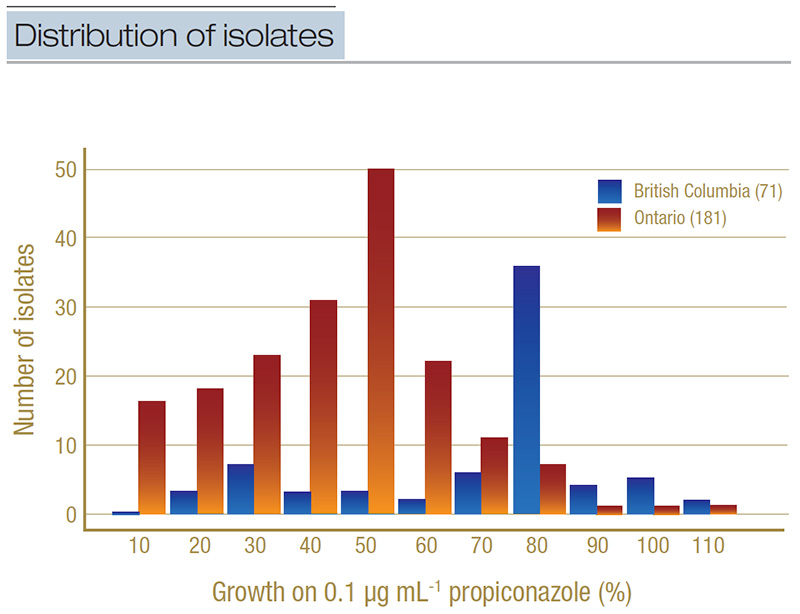
Figure 4. Distribution of isolates from Ontario (light orange) and British Columbia (dark blue) based on their percent growth on the discriminatory concentration of propiconazole (0.1 micrograms per milliliter). Isolates were grouped into percentage bands (for example, 0%-10%, 11%-20%, etc.), where growth on the baseline micrograms per milliliter was used as the denominator. The total number of isolates included in the discriminatory testing is in parentheses.
Discussion
The climate of coastal British Columbia creates high disease pressure for Microdochium patch for most of the year. In recent years, some turfgrass managers in the province have suspected they are dealing with fungicide resistance issues, with several
anecdotally reporting that applications of propiconazole in the form of Banner Maxx appeared to provide shorter intervals of control relative to previous years. The results of the sensitivity testing presented here support those observations, with
many isolates collected from southwestern British Columbia exhibiting significant resistance to propiconazole.
Propiconazole-resistant isolates collected from British Columbia had an average RF of 20.8, and resistant isolates from Ontario had an average RF of 7.9. The EC50 values and RFs of propiconazole-resistant isolates from the locations in Ontario and British
Columbia were similar to those reported for other fungal species showing DMI-resistance (4, 6, 7). However, a few isolates with high RF values in BC (RF>200) are concerning and could indicate the beginning of serious disease control problems. Field
resistance to the DMI fungicides has been documented in at least 28 species (2). However, this is the first lab-verified case of DMI resistance in M. nivale worldwide, and field trials are still necessary to confirm whether the observed resistance
translates to control failure in the field (as noted anecdotally by turfgrass managers in British Columbia).
Most locations in British Columbia and all locations in Ontario provided us with records of fungicide use for M. nivale (data not shown), which supported the hypothesis that higher usage of propiconazole was associated with resistance. These
results highlight the need for turfgrass managers to adhere to strong fungicide-resistance-management practices whenever possible. Future research can be conducted to determine if there are fitness costs, such as reduced virulence associated with
resistance, which could have implications for resistance management. Additionally, determining the genetic basis of propiconazole resistance in M. nivale would be useful, as it could have implications for possible cross-resistance to other
DMIs or other classes of fungicides depending on the mechanism.
Funding
This research was supported by the Canadian Turfgrass Research Foundation and the Ontario Ministry of Agriculture, Food and Rural Affairs. The original article can be found here: Gourlie, R., and T. Hsiang. 2021. Resistance to the demethylation-inhibiting
fungicide propiconazole in Canadian populations of Microdochium nivale. International Turfgrass Society Research Journal 1-4 (https://doi.org/10.1002/its2.98).
The research says ...
- Samples of diseased turfgrass collected from southwestern British Columbia yielded isolates that were resistant to the DMI fungicide propiconazole.
- Many of these isolates were also resistant to the dicarboximide fungicide iprodione.
- Resistance to both types of fungicides was less common in southern Ontario.
Literature cited
- Smiley, R.W., P.H. Dernoeden and B.B. Clarke. 2005. Compendium of Turfgrass Diseases (3rd ed.). American Phytopathological Society Press.
- Fungicide Resistance Action Committee. 2020. List of plant pathogenic organisms resistant to disease control agents. Fungicide Resistance Action Committee. https://bit.ly/3wLnLDa
- Gourlie, R., and T. Hsiang. 2017. Resistance to dicarboximide fungicides in a Canadian population of Microdochium nivale. International Turfgrass Society Research Journal 13(1):133-138 (https://doi.org/10.2134/itsrj2016.06.0497).
- Hsiang, T., L. Yang and W. Barton. 1997. Baseline sensitivity and cross-resistance to demethylation-inhibiting fungicides in Ontario isolates of Sclerotinia homoeocarpa. European Journal of Plant Pathology 103:409-416 (https://doi.org/10.1023/A:1008671321231).
- Sokal, R., and F. Rohlf. 1981. Biometry, the principles and practice of statistics in biological research. Freeman and Co.
- Köller, W., and J.P. Wubben. 1988. Variable resistance factors of fungicides acting as sterol demethylation inhibitors. Pesticide Science 26(2):133-145 (https://doi.org/10.1002/ps.2780260205).
- Golembiewski, R.C., et al. 1995. Detection of demethylation inhibitor (DMI) resistance in Sclerotinia homoeocarpa populations. Plant Disease 79:491-493 (https://doi.org/10.1094/PD-79-0491).
Ryan Gourlie (ryan.gourlie@agr.gc.ca) is now a doctoral student at the University of Lethbridge and works as a research technician for Agriculture and Agri-food Canada in Lethbridge, Alberta. Tom Hsiang (thsiang@uoguelph.ca) is a professor in the School
of Environmental Sciences at the University of Guelph in Guelph, Ontario.