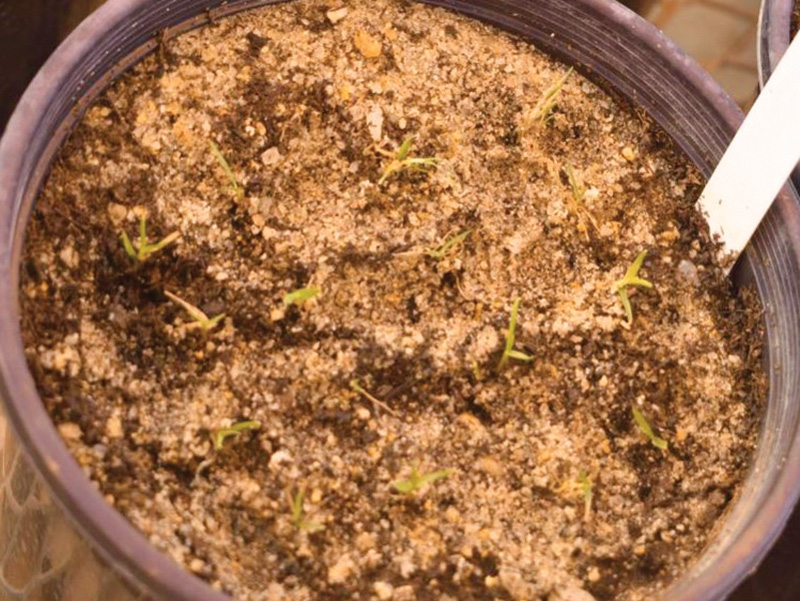
Figure 1. Annual bluegrass and creeping bentgrass tillers on day of planting. Tillers were alternatively planted so that next to each annual bluegrass tiller was a creeping bentgrass tiller and vice versa. Photo by Brandon McNally
Annual bluegrass (AB) is a problematic weed that infests turfgrass systems across the United States and is commonly found invading creeping bentgrass (CB) putting greens, fairways and roughs of golf courses. The high-volume seed production of AB disrupts
uniformity and playability of the turf, especially at putting green mowing heights. This weed often produces a large, intimidating seedbank, making long-term, sustainable control difficult.
Herbicide control options for AB in cool-season turfgrasses are limited, increasing the importance of nonchemical control strategies. Tweaking nutrient management programs for AB control has been studied for nearly a century, including the use of phosphorus
(P) fertilizer (8).
Despite years of research, evidence-based strategies for practitioners to manipulate P nutrition to suppress AB are unclear. Soil test recommendations for turfgrasses generally refer to all turfgrass species and were not created to provide recommendations
that give one turfgrass species a competitive advantage over another. Soil test P values of 2 to 4, 13 to 28, 16 to 30, or 27 to 54 ppm P are deemed sufficient for turfgrass species when using Morgan, Olsen-P, Bray-P1 or Mehlich-3 extraction methods,
respectively. The minimum level of sustainable nutrient determined a Mehlich-3 extractable P (M3P) soil test value of 21 ppm to be sufficient for good turf performance. Previous research has shown that in low-P soils, turfgrass responds to P application,
but there is typically no difference in response between the lowest and highest P rates.
Previous field experiments are difficult to compare, as different extraction methods were used to measure soil P, but typically these experiments find CB has a P requirement lower than what is recommended by soil testing labs. In a field study in Colorado,
CB putting green quality improved in a sand-based medium as soil test P increased from 1 ppm to 6 ppm (extraction method not specified), with no improvement thereafter (1). A field study in Utah reported that CB putting green quality in calcareous
sand was not improved by Olsen-P values greater than 3 ppm (3). Similarly, to obtain acceptable putting green quality in Wisconsin, the critical M3P soil test values for mature CB is reported to be between 6 ppm and 11 ppm (4).
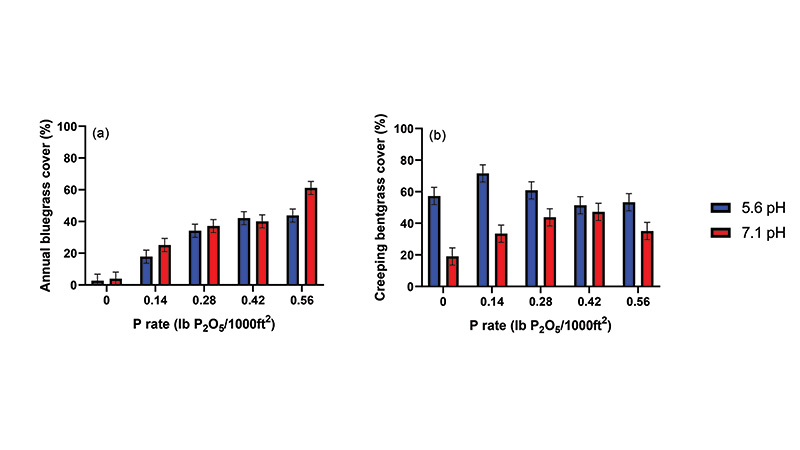
Figure 2. Annual bluegrass (a) and creeping bentgrass (b) cover affected by phosphorus (P) fertilizer rate and soil pH. Error bars that overlap are not significantly different according to Fisher's Protected LSD (α = 0.05) when compared across both soils.
Previous research found that AB has a higher P requirement than CB. In a 2-year-old sand-based CB putting green in Pennsylvania, AB encroachment increased when M3P was greater than or equal to 13 ppm (7). Similarly, at the conclusion of a 3-year study
in a 10-year-old CB putting green in Pennsylvania, AB cover was greater in soil with a soil test P value greater than or equal to 24 ppm compared to 12 ppm (extraction method not specified) (10). Adding 4 pounds P2O5 per 1,000 square feet (195.3 kilograms
per hectare) annually more than doubled AB presence on a colonial bentgrass putting green in Washington compared to adding no P (2). In a 4-year-old Chewings fescue-bentgrass putting green mixture grown in a sandy soil with 11 ppm P (extraction method
not specified), AB cover was higher in P-treated plots (0.5 to 1.0 pound P2O5 per 1,000 square feet [24.4 to 48.8 kilograms per hectare]) than in plots receiving no P (5). These studies suggest that P fertilization can enhance AB establishment in
mature putting greens. Despite several field experiments showing that CB thrives in low-P soils and that AB contamination increases with P rate, soil test P guidelines to reduce AB competitiveness in CB are still unclear.
Soil P available for plant uptake is influenced by soil pH. Maximum P availability occurs when soil pH is between 6.5 and 7.0. Annual bluegrass germination and development is greater when soil P availability is sufficient. Annual bluegrass shoot and root
growth is greater in a 6.5 pH soil compared to a 4.5 or 5.0 pH soil. Applying acidifying fertilizers can reduce pH and P availability, which can lead to less AB germination and infestation (8, 9).
Turf seedlings are thought to be more sensitive to P deficiencies than mature turf since seedlings have less extensive root systems. However, P application also promotes the germination and establishment of AB from seed. Previous research indicates low-P-rate
applications to P-deficient soils can reduce AB establishment from seed while providing sufficient vigor and health of CB establishing from seed (6). The potential to exploit differences in P requirements and manipulate pH to promote CB over AB led
us to develop this project. The objective was to determine if P application rate and soil pH influence sward composition of AB and CB established from tillers with similar initial root systems.
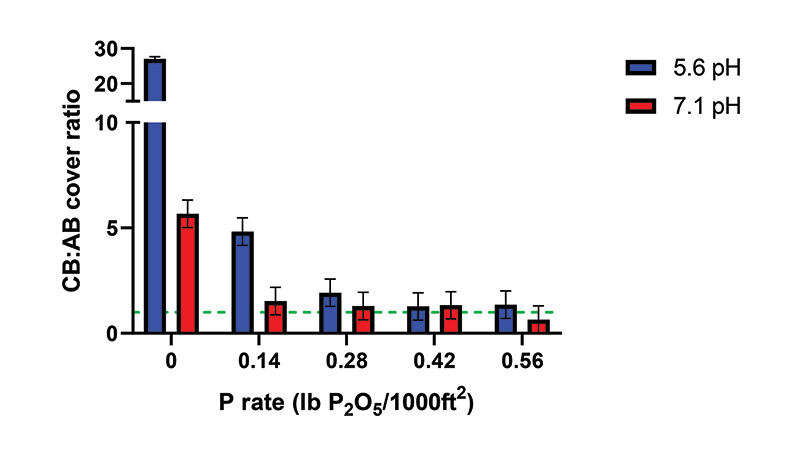
Figure 3. The ratio of creeping bentgrass (CB) cover to annual bluegrass (AB) cover as affected by phosphorus (P) fertilizer rate and soil pH. The green dashed line represents the 1:1 CB to AB ratio. Error bars that overlap are not significantly different according to Fisher's Protected LSD (α = 0.05) when compared across both soils.
Materials and methods
Research was conducted at the New Jersey Agricultural Experiment Station research greenhouse located at Rutgers University in New Brunswick, N.J. A 1:1 v/v silica sand-peat moss mixture filled each pot. The sand-based media had an initial M3P value of
4 ppm and pH of 5.5. There were two pH treatments in this study: Half of the sand media was untouched, and the other half received 1,200 ppm calcium carbonate to increase the soil pH. The final soil pH for this media was 7.1, and the final pH of the
untouched media was 5.6. Phosphorus was applied to the surface at rates of 0.14, 0.28, 0.42 or 0.56 pounds P2O5 per 1,000 square feet (6.84, 13.67, 20.51 or 27.34 kilograms per hectare) and mixed into upper 0.1 inch (0.25 centimeters) of the sand;
control pots received no P.
Twenty-four hours after P application, AB and 007 CB tillers were stripped from plugs, and their roots were trimmed to roughly 0.1 inches. Eight AB and eight CB tillers were planted in each pot in a four-by-four grid, 1 inch (2.54 centimeters) apart.
Tillers were alternatively planted so that next to each AB tiller was a CB tiller and vice versa (Figure 1).
All essential nutrients (except P) were brought up to sufficient soil test levels prior to the start of the experiment. Urea (46% nitrogen-0% phosphorus-0% potassium) was applied weekly to each pot at 0.2 pounds nitrogen per 1,000 square feet (9.76 kilograms
per hectare). Pots were individually watered two to three times weekly based on plant needs to optimize growth and prevent excessive soil moisture. Starting 14 days after planting, plants were mowed to 1 inch weekly using hand-held scissors, and clippings
were returned to the surface.
All data was collected 90 days after planting. Annual bluegrass and CB cover were measured by counting each species using a line-intersect method. Green cover was evaluated through digital images using a Nikon D5600 SLR camera and a lightbox. Turf quality
was visually assessed on a 1-to-9 scale, with 9 equal to perfect, green turf and 6 equal to the minimum acceptable level for turf quality.
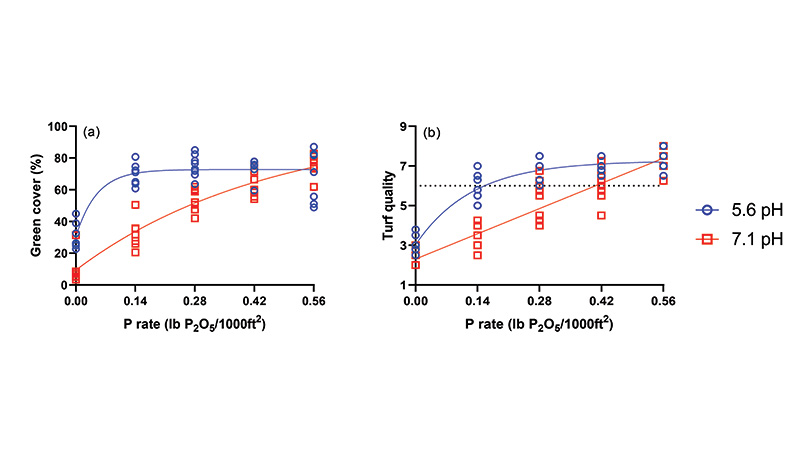
Figure 4. Relationship of phosphorus (P) fertilizer rate and green cover (a) and turf quality (b) at 90 days after planting when grown under two different soil pH levels. Turf quality was visually assessed on a scale of 1 (poor) to 9 (ideal), with 6 considered as the minimum acceptable level.
Results
When no P was applied, there was little AB (< 4% cover; Figure 2a). In the low-pH soil, AB cover increased with P rate from 0.14 pounds P2O5 per 1,000 square feet (18%) to 0.28 pounds P2O5 per 1,000 square feet (34%) to 0.42 pounds P2O5 per 1,000 square
feet (42%), while treatments of 0.42 and 0.56 pounds P2O5 per 1,000 square feet had similar AB cover (42% to 44%). Creeping bentgrass cover was greatest in the treatments of 0.14 and 0.28 pounds P2O5 per 1,000 square feet in the low-pH soil (72% and
61%, respectively; Figure 2b). Generally, CB cover was greater in the low-pH soil than the high-pH soil; soil pH caused differences in CB cover that were much larger for the treatments of 0 and 0.14 pounds P2O5 per 1,000 square feet. While CB displayed
its greatest competitive advantage when no P was applied to the low-pH soil (27-fold more CB than AB; Figure 3), CB growth was severely limited under these soil conditions, and this suggests that some P is required in this sand system for sufficient
CB growth. The treatment of 0.14 pounds P2O5 per 1,000 square feet, low-pH soil provided a smaller but substantial advantage for CB (approximately 5-fold more CB than AB). All other treatments had a cover ratio near 1:1 (CB:AB), with no differences
among those treatments.
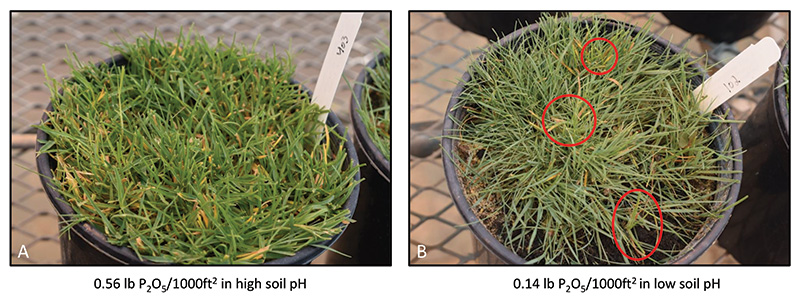
Figure 5.The treatment of 0.56 pounds P205 per 1,000 square feet, high pH (7.1) provided the most annual bluegrass cover (A), and the treatment of 0.14 pounds P205 per 1,000 square feet, low pH (5.6) provided sufficient creeping bentgrass cover while annual bluegrass establishment was poor and annual bluegrass tillers (circled in red) were being suppressed by the creeping bentgrass (B) at 90 days after planting. Photo by Brandon McNally
At low soil pH, green cover increased rapidly between 0 and 0.14 pounds P2O5 per 1,000 square feet and did not increase when rates exceeded 0.14 pounds P2O5 per 1,000 square feet (Figure 4a). At high soil pH, green cover steadily increased as P rate increased
but was consistently lower than the same P rate in the low-pH soil up until the rate exceeded 0.42 pounds P2O5 per 1,000 square feet. The treatments with the most CB cover (0.14 pounds P2O5 per 1,000 square feet, low-pH soil) and most AB cover (0.56
pounds P2O5 per 1,000 square feet, high-pH soil) had similar green cover (70% to 74%; Figures 4a, 5), indicating that a low-P rate in the low-pH soil provided similar turf establishment but with less AB.
Green cover was poor in the no-P-applied, low-soil pH treatment, even though there was a competitive advantage for CB (27-fold more CB than AB). The treatment of 0.14 pounds P2O5 per 1,000 square feet, low-pH soil was the only treatment that produced
an advantage for CB (approximately 5-fold) that also provided maximum green cover (Figure 4a). Therefore, to provide CB with a competitive advantage, reduce AB infestation, and achieve sufficient green cover, 0.14 pounds P2O5 per 1,000 square feet
in the low-pH soil was ideal in this sand system.
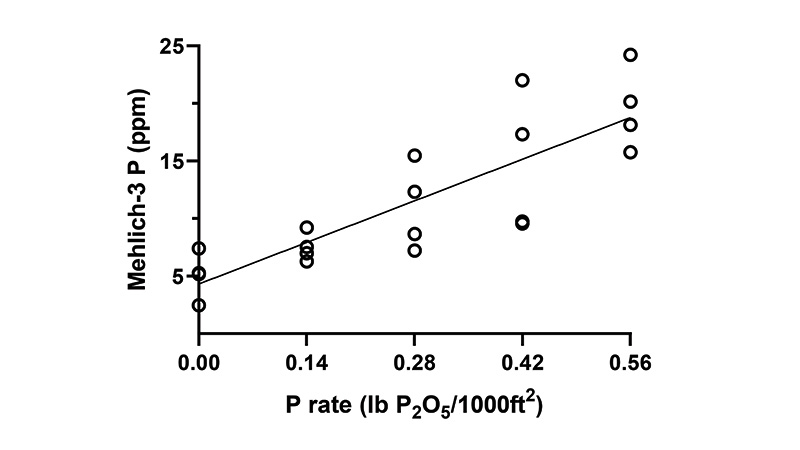
Figure 6. Mehlich-3 P soil test value as affected by phosphorus (P) fertilizer rate.
In the high-pH soil, turf quality improved steadily with P rate (Figure 4b). In the low-pH soil, turf quality improved as P rate increased from 0 to 0.28 pounds P2O5 per 1,000 square feet (3.0 to 6.8), with no significant increase thereafter (6.8 to 7.2).
The best turf quality was found in the rates of 0.28 to 0.56 pounds P2O5 per 1,000 square feet in the low-pH soil and rate of 0.56 pounds P2O5 per 1,000 square feet in the high-pH soil.
Mehlich-3 P soil test values linearly increased with P rate, which indicates P application reliably increased M3P (Figure 6). When evaluating AB cover through M3P soil test values, more AB was observed in the high-pH soil than low-pH soil when M3P values were the same (Figure 7a). This may be attributed to the higher-pH soil containing more plant-available soil P. Consequently, CB cover decreased as the M3P soil test value increased in the low-pH soil (Figure 7b); this CB cover decrease suggests AB vigor increased more than CB vigor as M3P increased. This is supported by the data that showcases an increase in AB cover in the low-pH soil as P rate increased, while CB cover remained steady or slightly declined (Figure 2), and by the vanishment of the CB competitive advantage as P rate increased (Figure 3). Green cover was maximized when M3P soil test value was greater than or equal to 5 ppm and greater than or equal to 7 ppm in the low- and high-pH soils, respectively (Figure 7c). Turf quality was acceptable (greater than or equal to 6.0) when M3P was greater than 4 ppm and greater than 6 ppm in the low- and high-pH soil, respectively (Figure 7d).
Results indicate that the optimum M3P for CB in the low-pH sand lies somewhere between 4 ppm and 6 ppm, with values closer to 4 ppm providing a large competitive advantage for CB. These M3P values are specific to this system but suggest there is a P concentration
range that can promote CB greater than AB.
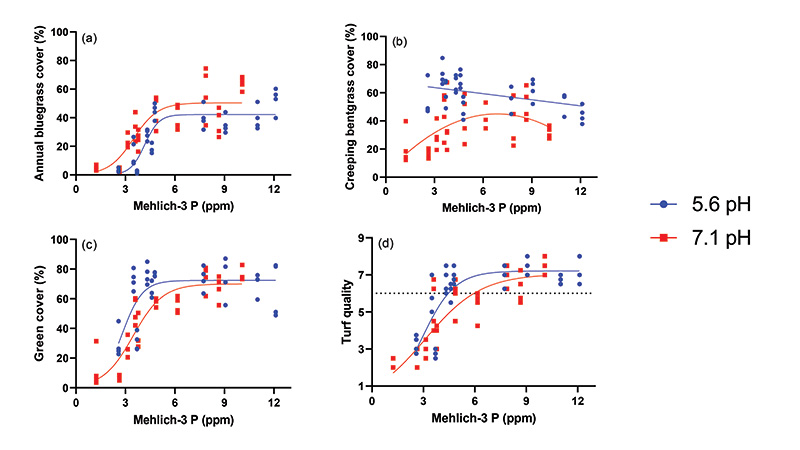
Figure 7. Relationship of Mehlich-3 phosphorus (P) and annual bluegrass cover (a), creeping bentgrass cover (b), green cover (c), and turf quality (d) when grown under two soil pH levels. Turf quality was visually assessed on a scale of 1 (poor) to 9 (ideal), with 6 considered as the minimum acceptable level.
Conclusion
Annual bluegrass was more competitive in the high-pH soil, and its competitiveness with CB increased with P rate. It is clear from this study that low P rates in a moderately acidic sand can provide a competitive advantage for CB over AB. This research
suggests that very low soil P concentrations (4 ppm to 6 ppm M3P) may be adequate for CB growth in moderately acidic sand (5.6 pH) and could reduce AB infestations. The range of soil test P values that were sufficient for CB growth and provided a
competitive advantage over AB was small, and the applicability of these results needs to be assessed in the field. The optimal soil test P value range may vary depending on soil type, pH, maturity of the turfgrass system and CB vigor required to produce
a high-quality playing surface. Field research is underway to determine how a P-depleted, moderately acidic sand mat layer affects CB and AB population dynamics.
The research says:
- Annual bluegrass is more competitive in high-pH soil, and its competitiveness with creeping bentgrass increases with the rate of phosphorus.
- Low phosphorus rates in a moderately acidic sand can provide a competitive advantage for creeping bentgrass over annual bluegrass.
- Low soil phosphorus concentrations (4 ppm to 6 ppm M3P) may be adequate for creeping bentgrass growth in moderately acidic sand (5.6 pH) and could reduce annual bentgrass infestations.
- The optimal soil test phosphorus value range may vary depending on soil type, pH, maturity of the turfgrass system and creeping bentgrass vigor required to produce a high-quality playing surface.
Funding
The authors would like to thank the USDA-NIFA Specialty Crops Research Initiative (SCRI) Grants Program (award #: 2018-51181-28436) for funding this project.
Literature cited
- Fry, J.D., M.A. Harivandi and D.D. Minner. 1989. Creeping bentgrass response to P and K on a sand medium. HortScience 24(4):623-624 (https://doi.org/10.21273/HORTSCI.24.4.623).
- Goss, R.L. 1974. Effects of variable rates of sulfur on the quality of putting green bentgrass. Pages 172-175. In: E.C. Roberts, Ed. Proceedings of 2nd International Turfgrass Research Conference. ASA and CSSA, Madison, Wis. (https://doi.org/10.2135/1974.proc2ndintlturfgrass.c23).
- Johnson, P.G., R.T. Koenig and K.L. Kopp. 2003. Nitrogen, phosphorus, and potassium responses and requirements in calcareous sand greens. Agronomy Journal 95(3):697-702 (https://doi.org/10.2134/agronj2003.6970).
- Kreuser, W.C., P.H. Pagliari and D.J. Soldat. 2012. Creeping bentgrass putting green Mehlich-3 soil test phosphorus requirements. Crop Science 52(3):1385-1392 (https://doi.org/10.2135/cropsci2011.08.0416).
- Lodge, T.A., T.W. Colclough and P.M. Canaway. 1990. Fertiliser nutrition of sand golf greens cover and botanical composition. Journal of Sports Turf Research Institute 66:89-99.
- McNally, B.C., M.T. Elmore, A.R. Kowalewski and A.B. Cain. 2022. Phosphorus influences annual bluegrass competitiveness at seeding in perennial ryegrass and creeping bentgrass. Agrosystems, Geosciences & Environment 5(4):1-11 (https://doi.org/10.1002/agg2.20321).
- Raley, R.B., P.J. Landschoot and J.T. Brosnan. 2013. Influence of phosphorus and nitrogen on annual bluegrass encroachment in a creeping bentgrass putting green. International Turfgrass Society Research Journal 12(10):649-656.
- Sprague, H.B., and G.W. Burton. 1937. Annual bluegrass (Poa annua L.) and its requirements for growth. Bulletin 630. Pages 1-24. New Brunswick, N.J.: New Jersey Agricultural Experiment Station.
- Varco, J.J., and J.B. Sartain. 1986. Effects of phosphorus, sulfur, calcium hydroxide and pH on growth of annual bluegrass. Soil Science Society of America Journal 50(1):128-132 (https://doi.org/10.2136/sssaj1986.03615995005000010025x).
- Waddington, D.V., T.R. Turner, J.M. Duich and E.L. Moberg. 1978. Effect of fertilization on Penncross creeping bentgrass. Agronomy Journal 70(5):713-718 (https://doi.org/10.2134/agronj1978.00021962007000050005x).
Brandon C. McNally (bmcnall@purdue.edu) is a research associate at Purdue University, Department of Horticulture and Landscape Architecture, West Lafayette, Ind.; and Matthew T. Elmore is an associate Extension specialist, James A. Murphy is an Extension
specialist and Stephanie L. Murphy is director of the Rutgers Soil Testing Laboratory, all in the Department of Plant Biology, Rutgers University, New Brunswick, N.J.