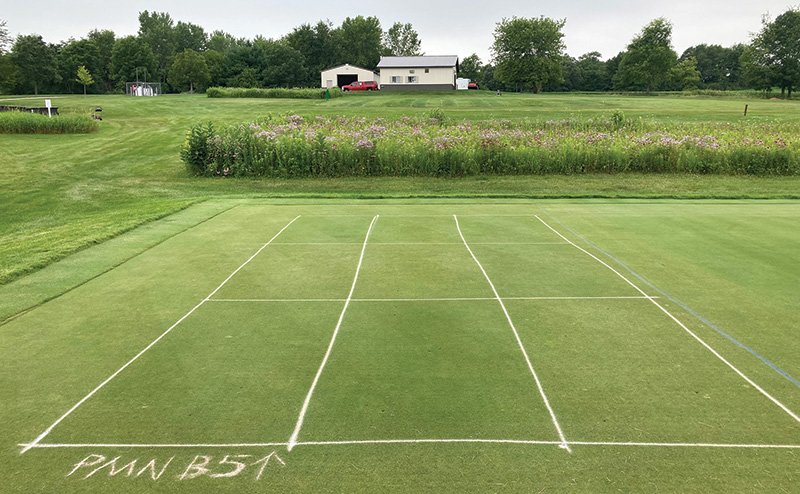
Research was conducted in 2020 and 2021 at the University of Wisconsin-Madison O.J. Noer Turfgrass Research and Education Facility in Verona, Wis. Photo by Qiyu Zhou
Nitrogen (N) is typically the most limiting nutrient for turfgrass growth, because turfgrass is usually managed at a relatively low growth rate when maintaining playability and reducing labor associated with mowing. Applying the right amount of N fertilizer
to maintain a low turfgrass growth rate, thereby reducing mowing frequency while still overcoming stresses, such as traffic, is one of the most effective ways to optimize resource use. Besides N fertilizer applications, N released from soil organic
matter is the other primary N source on sand-based putting greens.
However, there are still difficulties in accurately and quickly estimating the soil organic matter decomposition rate or how much available N would be released on sand-based putting greens during the growing season. Several laboratory and in situ tests
have been investigated to quantify soil potential N mineralization, but these methods usually require several weeks of soil incubation and are not offered in routine soil testing. A rapid soil testing method that is capable of estimating soil N mineralization
would be needed for sand-based putting greens.
Studies over the past two decades (1, 2, 3) have shown a positive correlation between soil mineralizable carbon (min-C) and soil mineralizable N. Specifically, there was a strong correlation between soil mineralizable N and min-C, where min-C was quantified
after a 24-hour soil incubation.
Recently, studies have used min-C test kits on Kentucky bluegrass and tall fescue lawn and indicated the min-C could guide annual N applications for native soils (4, 5). However, min-C has not yet been evaluated on sand-dominated putting green root zones.
Because of the differences between constructed sand root zones and the finer-textured native soils, there is a need to evaluate the relationship between the 24-hour incubation min-C and turfgrass performance on golf course sand-based putting green
soils and whether it is a useful tool for guiding N fertilization for USGA greens.
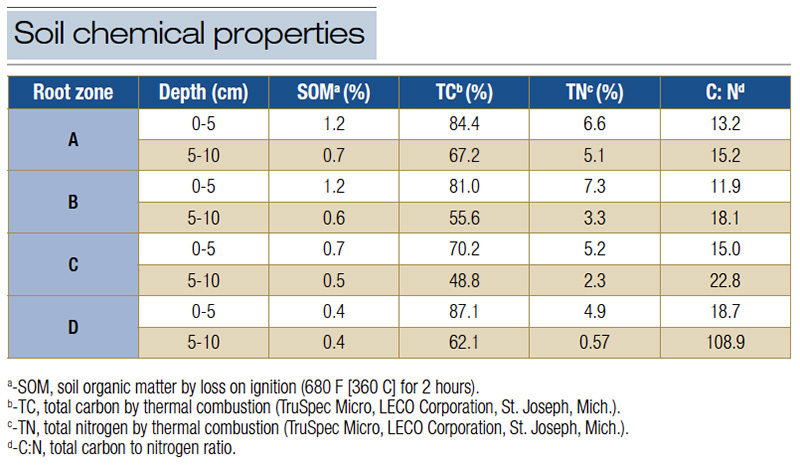
Table 1. Soil chemical properties of two putting green root zones at the University of Wisconsin-Madison O.J. Noer Turfgrass Research and Education Facility in Verona, Wis., where the soil samples were collected before the first treatment in 2020. The soil chemical properties were also used for creating or evaluating the soil temperature prediction models based on weather data.
Methods and materials
Study site and experimental design
Two-year field experiments were conducted on four USGA putting green root zones (Table 1) in 2020 and 2021 at the University of Wisconsin-Madison O.J. Noer Turfgrass Research and Education Facility in Verona, Wis. The putting greens were planted with
Focus creeping bentgrass (Agrostis stolonifera L.). Turfgrass was maintained at a height of 0.12 inches (3.1 millimeters) and mowed at least five times weekly. Research greens were well-watered daily and were topdressed with 8.57 cubic feet per acre
(0.6 cubic meters per hectare) of sand approximately every three weeks during the growing season. Hollow-tine cultivation was conducted once a year in September with the cores removed and holes filled with topdressing sand. Diseases and other pests
were monitored and controlled as needed. Prior to initiation of this study, research greens were fertilized with liquid urea at 8.92 pounds N per acre (10 kilograms per hectare) every two weeks, and no other N sources were used.
Soil and turfgrass sampling
Daily field air temperature and soil temperature were recorded. Volumetric soil moisture content from each plot was measured three times a week at 3 inches (7.6 centimeters) depth. Three soil samples from each plot were collected to a 3.94-inch (10-centimeter)
depth with a 0.59-inch (1.5 centimeter) diameter soil probe every five weeks. Each core was separated into 0-1.97-inch (0-5-centimeter) and 1.97-3.94-inch (5-10-centimeter) depth increments, and samples representing the same depth and within the same
plot were combined for analysis. Collected soil samples were allowed to air dry for at least one week, then passed through a 0.08-inch (2-millimeter) sieve after being gently ground with a mortar and pestle.
Mineralization carbon was determined by measuring soil-released CO2 after 24 hours of incubation (2). Briefly, 0.35 ounces (10 grams) of dried soil sample was added to deionized water until the soil reached ~50% water-filled pore space. Then, the soil
was placed into a 32-ounce (946-milliliter) mason jar, and the jar was sealed and incubated in the dark for 24 hours at 77 F ± 1.8 F (25 C ± 1 C). Released CO2 was measured using an LI-820 CO2 analyzer (LI-COR Biosciences, Lincoln, Neb.).
Clean and dried clipping yield was collected three times a week. The clippings collected on the same day as soil samples were used to determine tissue N content by a combustion analyzer (TruSpec Micro, LECO Corporation, St. Joseph, Mich.). Turfgrass
N uptake was estimated by multiplying the tissue N content from the most recent sampling by the measured dry clipping mass for each clipping collection date.
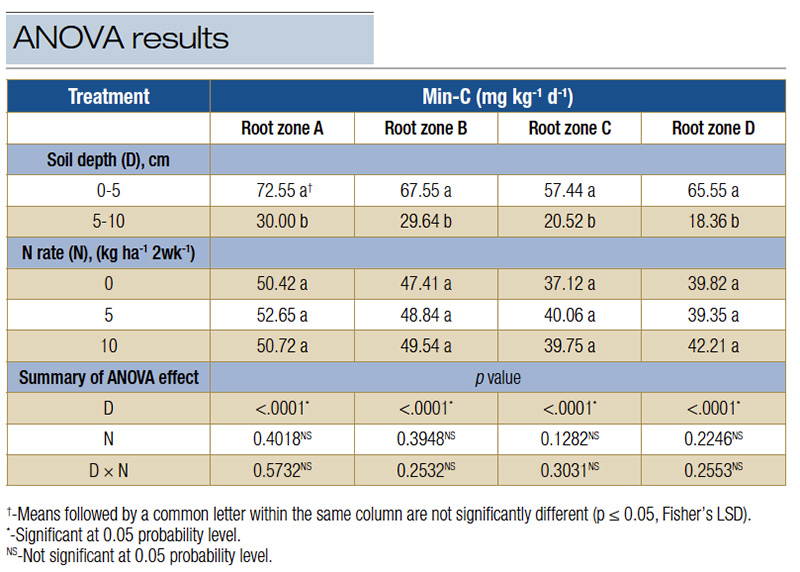
Table 2. ANOVA results of mineralizable carbon (min-C) rates in response to two soil depths (0-5 cm and 5-10 cm), three urea N fertilization rates (0, 5, 10 kilograms per hectare per two weeks), soil sample collection date and their interaction effects on four different putting green sand-based root zones (A, B, C, and D).
Results
24-hour mineralizable carbon (min-C) is not related to turfgrass growth and N uptake on sand-based putting greens
Soil depths mainly affect min-C, with min-C at 0-1.97-inch depth significantly higher than the min-C from 1.97-3.94-inch root zone (Table 2), and the results were consistent across all four putting green root zones. Because of the lack of residual fertilizer
from slow-release granules (only liquid urea fertilizer was applied to the area for years prior to the initiation of this study), creeping bentgrass N uptake from the no-N treatment can be assumed to be representative of net soil N mineralization.
Nitrogen fertilizer rate had no effect on min-C, regardless of root zones (Table 2).
There were weak to no relationships (r2 = 0-0.23, data not shown) between creeping bentgrass N uptake and min-C at two soil depths on all four root zones. In contrast to our finding, Moore et al. (5) reported a stronger correlation between soil min-C
and turfgrass N uptake, where the min-C was measured at room temperature. It is worth noting that the study conducted by Moore et al. (5) was conducted on Paxton fine sandy loam soils with a much wider range of soil organic matter and N fertilization
rates (ranging from 44.61-1,784.36 pounds per acre per year [50 to 2,000 kilograms per hectare per year]) with organic fertilizer plus additional application of four rates of urea fertilization rates (44.61 to 178.44 pounds per acre per year [50 to
200 kilograms per hectare per year).
Microbial biomass, microbial activity and soil C and N availability may have been substantially different from the soil used in this study, all of which can affect soil min-C. This implies that soil texture or soil organic matter content and management
practices would largely affect the usefulness of using min-C to estimate potential soil N supply and plant N need.
24-hour mineralizable carbon (min-C) on sand-based putting greens is highly sensitive to environmental factors
Average air temperature, soil temperature and soil moisture were all negatively correlated with 24-hour min-C on four root zones at two soil depths (Table 3; table only presents data collected from 0-1.97-inch depth). These negative relationships are
likely due to a relatively large amount of labile carbon in the turfgrass root zone and the differences in microbial activity than between the field and laboratory incubation conditions. Field soil temperature as well as soil moisture content in the
field varied and were often different from the lab incubation conditions which were constant at 77 F and ~50% water-filled pore space (Figure 1). Temperature and moisture are two of the most important environmental factors affecting microbial activity.
When in situ soil temperature and moisture are low, microbes process soil labile C, resulting in minimal soil mineralization rates in the field. When analyzing the soil in the lab, the 24-hour incubation min-C value would likely be higher than the
one in the field, as the incubation temperature and moisture are more conducive to microbial activity. Conversely, during periods of relatively high temperature and moisture in the field compared to lab incubation conditions, microbes rapidly processed
labile C in the field, resulting in lower min-C values quantified in the lab. This framework is supported by the data from samples collected in early May and late October of 2020, and early May of 2021, in which field air temperature, soil temperature
and soil moisture content were significantly lower than the lab incubation condition, and the microbial activity was higher in the lab compared to the field. Similarly, samples collected in the summer (when the temperature is higher in the field compared
to lab incubation) often had the lowest min-C values. It was clear that there were strong relationships among the environmental variables and the lab-measured 24-hour min-C, calling into question the value and reliability of using 24-hour min-C to
make inferences about this particular system — an N-limited creeping bentgrass putting green on a sand root zone.
In summary, although min-C, quantified by 24-hour soil incubation at 77 F, was recognized as a simple and rapid test for predicting net soil N mineralization of native soil and estimating crop N uptake, our study indicates that the 24-hour min-C is not
related to creeping bentgrass growth or N uptake on sand-based putting root zones. In the specific conditions of our study, the test does not hold value for estimating creeping bentgrass N needs and does not appear to be useful for turfgrass managers
to make N fertilization decisions on sand-based putting root zones.
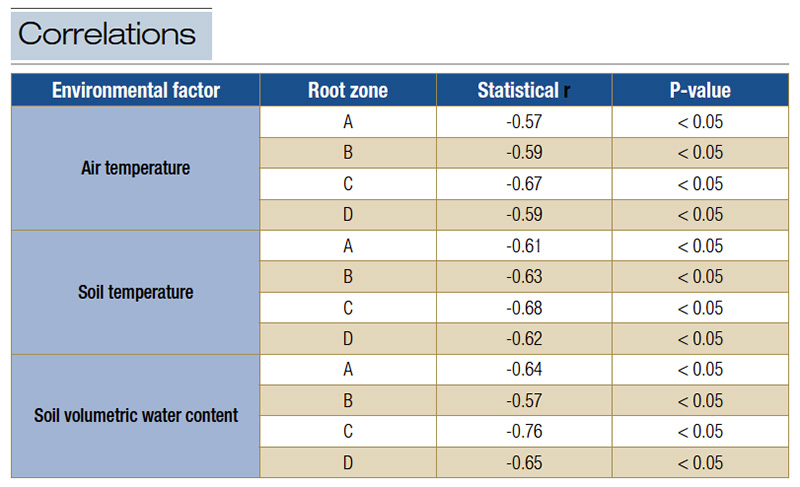
Table 3. Correlations between air temperature, soil temperature and soil moisture with 24-hour Min-C on four root zones at 0-1.97-inch depth.
The research says
- Nitrogen fertilizer rate had no effect on min-C, regardless of root zones.
- Soil texture or soil organic matter content and management practices would largely affect the usefulness of using min-C to estimate potential soil N supply and plant N need.
- Although min-C, quantified by 24-hour soil incubation at 77 F, was recognized as a simple and rapid test for predicting net soil N mineralization of native soil and estimating crop N uptake, our study indicates that the 24-hour min-C is not related
to creeping bentgrass growth or N uptake on sand-based putting root zones.
- In the specific conditions of our study, the test does not hold value for estimating creeping bentgrass N needs and does not appear to be useful for turfgrass managers to make N fertilization decisions on sand-based putting root zones.
Acknowledgments
We thank Mike Katzenberger, Dimi Schweitzer, Abigail Chapman, Travis Miller and Megan Hart for their help with the turfgrass and soil sample collection and processing, and USGA, Wisconsin Turfgrass Association and Wisconsin GCSA for providing partial
financial assistance for this project.
Literature cited
- Franzluebbers, A.J. 2016. Should soil testing services measure soil biological activity? Agricultural & Environmental Letters 1(1):150009 (https://doi.org/10.2134/ael2015.11.0009).
- Franzluebbers, A.J., and J.A. Stuedemann. 2008. Early response of soil organic fractions to tillage and integrated crop-livestock production. Soil Science Society of America Journal 72(3):613-625 (https://doi.org/10.2136/sssaj2007.0121).
- Haney, R., F. Hons, M. Sanderson and A. Franzluebbers. 2001. A rapid procedure for estimating nitrogen mineralization in manured soil. Biology and Fertility of Soils 33(2):100-104 (https://doi.org/10.1007/s003740000294).
- Moore, D.B., K. Guillard, T.F. Morris and W.F. Brinton. 2019. Correlation between Solvita labile amino-nitrogen and CO2-burst soil health tests and response to organic fertilizer in a turfgrass soil. Communications in soil science and plant analysis
50(22):2948-2959 (https://doi.org/10.1080/00103624.2019.1689258).
- Moore, D.B., K. Guillard, T.F. Morris and W.F. Brinton. 2019. Predicting cool-season turfgrass response with Solvita soil tests, Part 2: CO2-burst carbon concentrations. Crop Science 59(5):2237-2248 (https://doi.org/10.2135/cropsci2018.11.0707).
Qiyu Zhou (qzhou9@ncsu.edu) is an assistant professor of turfgrass management at North Carolina State University, Raleigh; Doug Soldat is a professor and chair of Soil Science Extension, and Matthew Ruark is a professor and Extension soil scientist, both
at the University of Wisconsin-Madison.