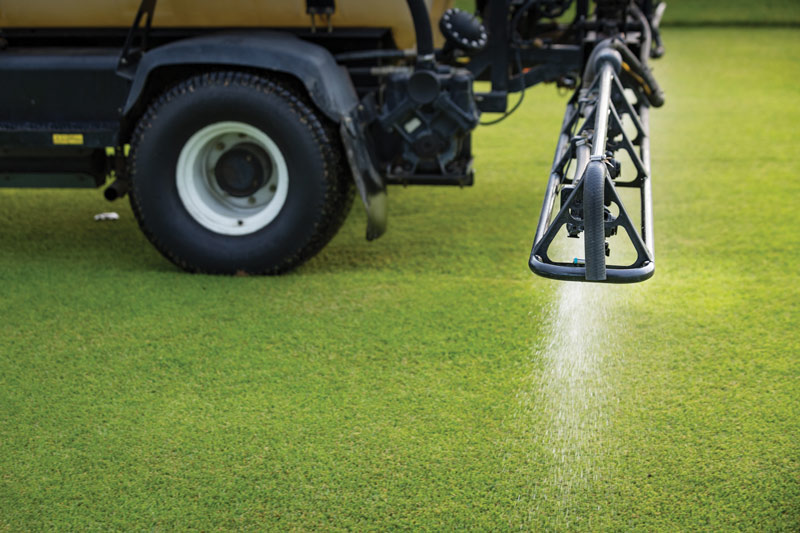
Researchers at the University of Wisconsin-Madison and Cornell University surveyed the pesticide use on 22 golf courses in New York and Wisconsin. They found spot spraying to be one of three universal strategies to reduce pesticide use, but it requires diligent scouting and expertise. Photo courtesy of PBI-Gordon
Pesticides are viewed as essential tools by golf course superintendents to address pest management concerns that compromise the aesthetic and functional performance of the playing surface. However, it is vital to recognize and even quantify the potential environmental risk associated with pesticide applications. Pesticide risk assessment has traditionally been studied in agricultural systems, though few studies have attempted to quantify pesticide risk on golf courses. The goal of this study was to develop a method capable of estimating the environmental risk associated with pesticide use on golf courses and compare those to other land-use types.
Defining pesticide risk
The risk associated with chemical pesticides depends on two primary factors: toxicity and exposure. Exposure is the quantity of pesticide applied, while toxicity, as the name suggests, refers to how toxic the pesticide is to a given organism. Ideally, a pesticide is toxic to the target pest, but not toxic to nontarget organisms such as birds, fish, mammals and beneficial arthropods. The most common toxicity value for pesticides is mammalian toxicity, approximated from testing conducted on rats. Taken together, the factors of exposure (i.e., how much is applied) and toxicity (i.e., the effect of the chemical on nontarget animal groups of interest) defines pesticide risk.
Modeling pesticide risk to the environment
It is difficult to measure the myriad potential risk factors associated with pesticide application in the field. Such research requires sampling water, soil, plants, animals and insects, under various climatic and topographical conditions, and then conducting detailed extraction and lab analysis of samples for pesticide compounds or byproducts. These methods are time-consuming and costly, limiting their applicability at a variety of sites. A commonly used approach in the study of risk assessment is to model or estimate pesticide risk mathematically using Pesticide Risk Indicator Models.
Quantifying the environmental risk of pesticide applications in a mathematical model has been a topic of great debate and disagreement within the scientific community due to the infinite complexity of pesticide interactions with the environment. Pesticide Risk Indicator Models are simple mathematical equations that produce risk scores based on readily accessible toxicity and exposure data. In our research, we considered many pesticide risk models, but ultimately settled on using two models that use markedly different approaches to determine pesticide risk. Theoretically, if two models that are constructed quite differently both conclude similar levels of risk, there is a greater likelihood these assessments are accurate.
The Hazard Quotient (HQ) and Environmental Impact Quotient (EIQ) models were selected for this study. The HQ model simply and quantitatively produces pesticide risk scores. However, the model only considers a single organismal group (e.g., mammals) at a time. Comparatively, the EIQ allows prediction of pesticide risk to the environment broadly, but this generalized nature creates more uncertainty in the model structure. For a more technical description of the advantages and disadvantages of both HQ and EIQ, please see our paper in Science of the Total Environment (link at end of article).
Methods
The HQ and EIQ models were adapted to calculate risk scores for each golf course component (greens, tees, fairways and roughs). Within each component, the models generate two types of risk scores: 1) absolute risk, and 2) area normalized risk. Absolute risk defines the total amount of risk, while area normalized risk is simply the absolute risk divided by the area of the golf course component. To give an example using arbitrary numbers, if the absolute risk score is 500 for greens, and your greens cover 5 acres, then the area normalized risk score would be 100 (500/5).

According to this research, in most cases, reducing golf course pesticide risk can be most effectively achieved by changes to fairway management. Photo by Carl S. Schimenti
A risk score for each component is helpful if you want to compare risk between components, but we also wanted to calculate a risk score for an entire golf course. To do this, we took an area-weighted average of the risk scores for each component to generate a golf-course-wide risk score. We refer to this as the component weighted average (CWA).
In addition to calculating the pesticide risk, we also calculated pesticide use intensity. Pesticide use intensity was calculated on each golf course component using the area treatment model. Area treatments are calculated in relation to the average application rate of a given product. For example, an area treatment value of 1 occurs if a pesticide is applied at the average rate to all greens (or any golf course component). An area treatment value of 0.5 could be obtained either by applying a pesticide at a half rate to all greens, or by applying at the average rate to half of the greens area.
Data were collected on pesticide use from 22 golf courses, 11 in Wisconsin and 11 in New York. Data reporting requirements included the date of every pesticide application, product name, rate of application, area applied and golf course component on which the application was made. Pesticide risk and use intensity metrics were calculated for each course as a three-year mean for 2016, 2017 and 2018. Additionally, pesticide risk and use intensity metrics were calculated for five crops systems — apples, carrots, corn, grapes and potatoes — for comparison with golf courses.
Results
First, these results must be qualified in that they represent the prevailing pesticide use on golf courses in the northeastern and north-central U.S. Risk assessment in different growing regions might provide different results based on the pest pressure associated with a climate.
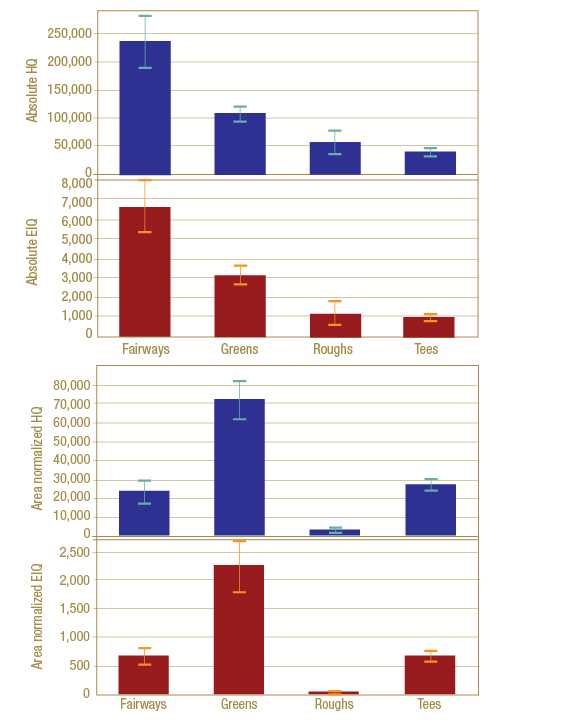
Figure 1. Top (A): Absolute Environmental Impact Quotient (EIQ) and Hazard Quotient (HQ) by golf course component on the 22 golf courses in the study. Bottom (B): Area normalized EIQ and HQ by golf course component on the 22 golf courses in the study. Error bars indicate the standard error (i.e., variability across the 22 golf courses in the study).
Absolute pesticide risk on golf courses was highest on fairways, more than twice that of greens and approximately four times that of roughs, according to both HQ and EIQ (Figure 1A). Area normalized risk was over three times higher on greens than on fairways or any other component (Figure 1B). Even though greens have much higher area normalized risk than fairways, given their large size, fairways have a higher absolute risk score. These data indicate that if reductions in pesticide risk are desired, superintendents should prioritize pest management programs on fairways to: reduce the area treated (spot-treat); reduce the number of annual pesticide applications; and/or select products that possess lower pesticide risk values.
There was a tremendous amount of variability in course-to-course pesticide risk values. Variability in risk values was highest on fairways and roughs, but also high on greens and tees (Figure 1). The range of pesticide risk values is likely because of the wide range of facilities surveyed across budget size, expectations and resource use levels. Facilities that wish to reduce risk and regularly treat fairways and/or large rough areas should focus reductions strategies to these areas, while facilities that limit pesticide use will generally cut risk most effectively by focusing on risk reduction on greens.
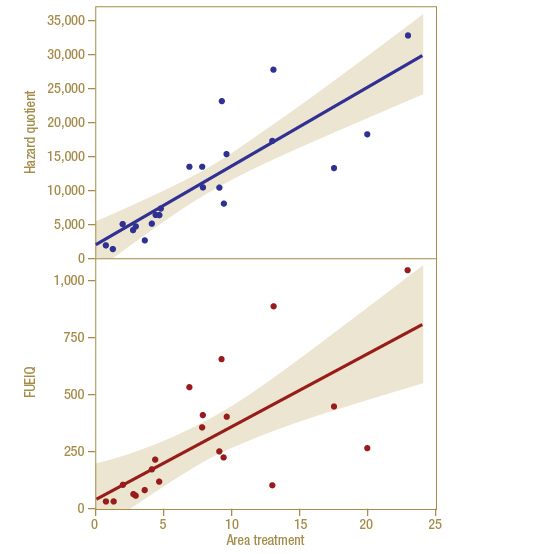
Figure 2. The Risk to Intensity Quotient (RIQ). Area-normalized component-weighted-average (AN-CWA) Environmental Impact Quotient (EIQ) and Hazard Quotient (HQ) correlated with area treatment. Shaded areas represent 95% confidence interval for mean value of y for a given x value.
The ratio of pesticide risk (HQ or EIQ) to pesticide use intensity (area treatment) quantifies the average risk of product selection. This ratio is defined for the purposes of this study as the Risk to Intensity Quotient (RIQ). The RIQ is illustrated in Figure 2 (above), where courses below the correlation line used lower-risk pesticides compared to the average, while courses above the line used higher-risk pesticides. The RIQ could be a useful future metric for superintendents to consult as a measure of product selections’ contribution to overall pesticide risk.
In New York and Wisconsin, area normalized pesticide risk in golf turf was higher than corn and carrot production, and lower than apple, grape and potato production (Table 2, below). Area normalized pesticide risk of individual course components mirrored that of crop systems, as greens were comparable to potato production, fairways/tees to grape production, and roughs to carrot production (Tables 1 and 2, below).
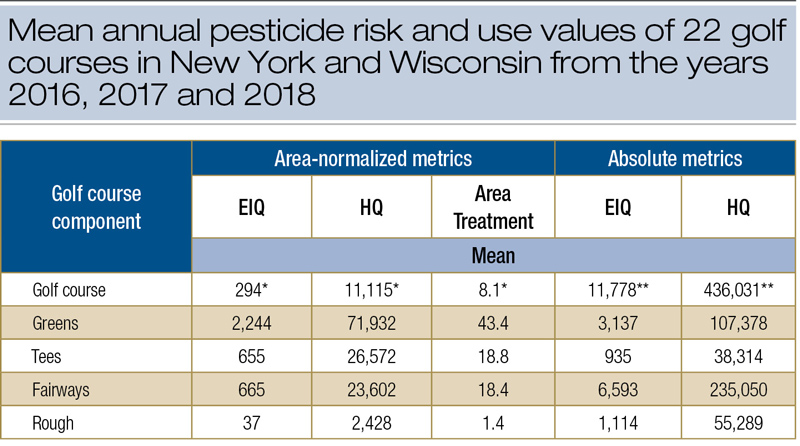
Table 1. *Component weighted average; **sum of components (greens, tees, fairways and roughs)
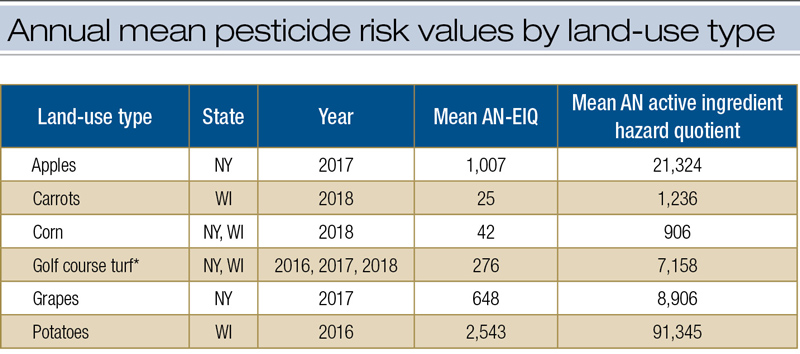
Table 2. AN-area normalized; EIQ-Environmental Impact Quotient; *component weighted average
These data underscore the spatial variability of golf course pesticide use relative to other land-use types. While components of golf courses receive routine pesticide use, much of the land area encompassing golf course property receives few, if any, pesticide applications.
What does this mean for golf course superintendents?
Data in this study was specific to golf courses in the north-central and northeastern United States, but findings on pesticide reduction strategies are universal. The three practices to reduce pesticide risk are:
- Reducing the number of pesticide applications.
- Spot treatment.
- Product selection.
Reducing pesticide application frequency is not simple. It may require “leaps of faith” to withhold pesticide applications. At most facilities, reducing the number of applications can be achieved through an increased reliance on cultural practices for pest control or upgrading turfgrass varieties.
Spot treatment is an incredibly effective method to reduce pesticide risk but requires diligent scouting and expertise to execute. GPS sprayers are a form of spot treatment, as they have been shown to reduce pesticide use between 15% and 20% simply by eliminating overspray (1).
Lastly, product selection can be used to choose pesticide products that present lower environmental risk while still providing adequate pest control at a reasonable price point. The RIQ metric presented in this study can be a simple way to analyze the average annual risk of product selection. The EPA’s Reduced Risk program is another good resource to find pesticides with lower risk profiles.
The methods developed in this study can be used to go above and beyond pesticide reporting requirements. Tracking pesticide risk would go far in showing regulators the importance superintendents place on environmental responsibility. However, calculating pesticide risk is time-consuming and complicated. Software programs that calculate pesticide risk are likely the best way to track pesticide risk at your golf course. Playbooks For Golf allows users to track EIQ. For a custom spreadsheet to calculate EIQ or HQ values, you can contact the Cornell Turfgrass Program.
In Denmark, all golf courses are required to track pesticide risk using a model similar to EIQ. Under the agreement reached in Denmark between the government and the Danish Golf Union, each golf course has a maximum allowable pesticide risk annually. While such legislation seems unlikely to pass in the U.S., many superintendents have commented that they are concerned about forthcoming regulations that may limit the wide range of pesticides that are currently available to U.S. superintendents. Tracking pesticide risk at your course and reducing risk will likely put your pesticide application program on a path that will not be affected by any forthcoming U.S. regulations.
Conclusion
The framework derived in this study allows for the quantification of golf course pesticide risk. Understanding current levels of pesticide risk is critical to their reduction. The sample of 22 golf courses in the north-central to northeastern U.S. indicates the special importance of fairway management and product selection in reducing overall pesticide risk. Metrics such as the RIQ may help superintendents by highlighting the importance of product selection in reducing risk.
Acknowledgments
This work has been adapted from the following publication: Bekken, M.A.H., C.S. Schimenti, D.J. Soldat, F.S. Rossi. 2021. A novel framework for estimating and analyzing pesticide risk on golf courses. Science of the Total Environment. 783: 146840 (https://doi.org/10.1016/j.scitotenv.2021.146840).
The research says ...
- Facilities that wish to reduce pesticide risk and regularly treat fairways and/or large rough areas should focus reductions strategies to these areas, while facilities that limit pesticide use will generally cut risk most effectively by focusing on risk reduction on greens.
- Reducing pesticide application frequency is not simple. It may require “leaps of faith” to withhold pesticide applications. At most facilities, increased reliance on cultural practices for pest control or upgrading turfgrass varieties can reduce pesticide application.
- Spot treatment is incredibly effective in reducing pesticide risk but requires diligent scouting and expertise. Spot treatments using GPS sprayers can reduce pesticide use 15% to 20% simply by eliminating overspray.
- Some pesticide products present lower environmental risk while still providing adequate pest control at a reasonable price point. Use the RIQ metric presented in this study to analyze the average annual risk of product selection. The EPA’s Reduced Risk program is another good resource to find pesticides with lower risk profiles.
Literature cited
- Gilhuly, Larry. 2017. The benefits of precision spraying. USGA.org.
Michael A.H. Bekken is a doctoral student, and Douglas J. Soldat is a professor in the Department of Soil Science at the University of Wisconsin, Madison, Wis. Carl S. Schimenti is an Extension support specialist, and Frank S. Rossi is an associate professor in the School of Integrative Plant Science, Horticulture Section, Cornell University, Ithaca, N.Y.