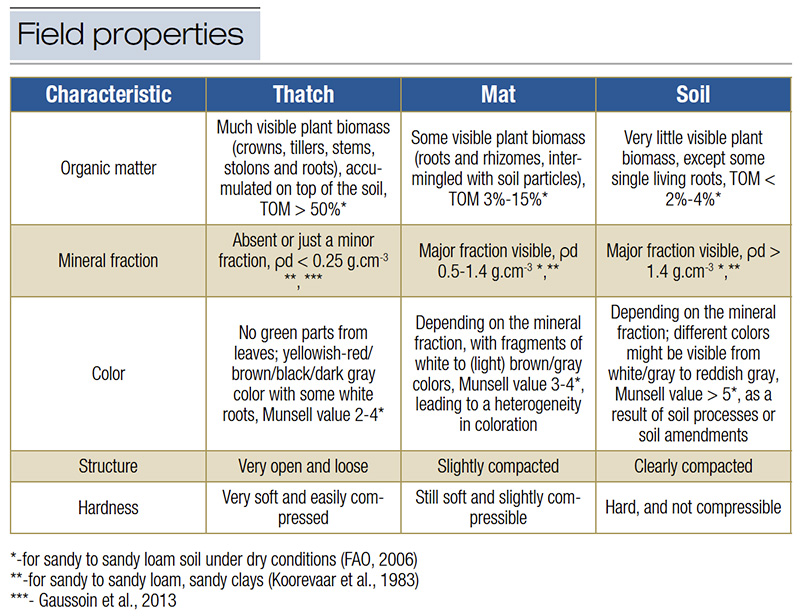
Table 1. Observable properties in the field to distinguish thatch, mat and soil.
In turfgrass soils, organic matter accumulation occurs rapidly after seeding. This accumulation is primarily due to the natural formation of plant biomass, which varies among specific turfgrass (sub)species, cultivars and mixtures of (sub)species and cultivars, as noted by Evers (1).
It is widely recognized that climate change, extreme weather conditions or high inputs of fertilizers or water significantly accelerate organic matter accumulation in turfgrass soils. Over time, this buildup often becomes excessive, resulting in the formation of distinct layers within the turfgrass system: canopy, thatch, mat and soil. Identifying these layers — thatch, mat and soil — is critical for implementing appropriate maintenance actions to reduce excessive organic matter accumulation, preserve turfgrass health and optimize playability. However, ambiguity in terminology and sampling methods has led to the adoption of the combined term “thatch-mat” since the late 2000s, which obscures important distinctions relevant to turfgrass maintenance. The goal of this research was to develop a new, reliable and reproducible method to differentiate between thatch, mat and soil layers.
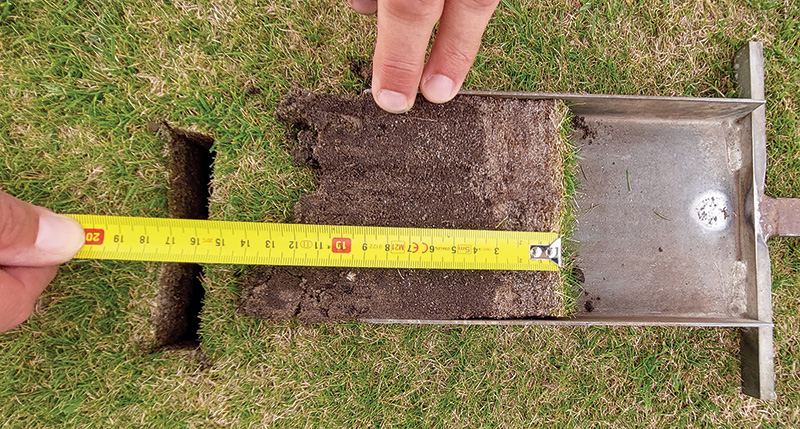
Figure 1. The methodology involves identifying thatch, mat and soil layers based on characteristics in Table 1 and measuring the boundaries between these layers in a freshly collected soil profile or core sample (3.9-7.8 inches/9.9-19.8 centimeters deep). To get started, after collecting a soil profile, position it horizontally. Place the hook of a tape ruler at the profile’s top edge and pull down gently using moderate force until resistance is encountered.
Defining thatch, mat and deeper soil
The terms “thatch” and “mat” originated in the 1940s and 1950s, with early studies suggesting their formation was linked to distinct conditions. Thatch refers to a loose layer of mixed dead and living stems and roots, containing undecomposed or partially decomposed organic material, situated above the soil surface. Mat is defined as a denser layer, predominantly composed of decomposed organic material tightly intermingled with mineral soil particles, typically brown in sandy root zones. This study differentiates thatch and mat based on morphological, textural and color differences, using the soil horizon classification system of the Food and Agriculture Organization (FAO) (3) and Schoeneberger (6). Table 1 outlines the observable differences between these soil layers.
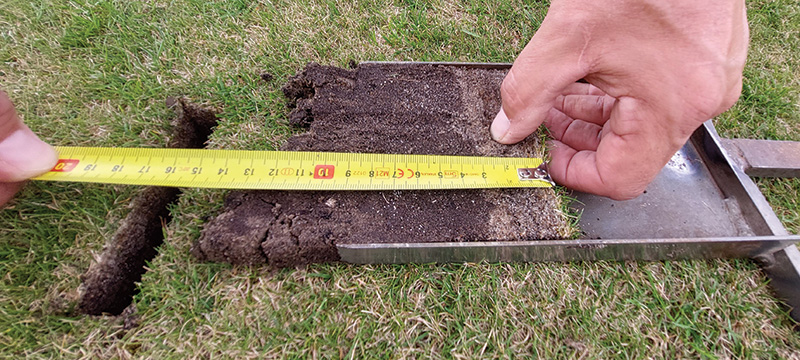
Figure 2. Measure thatch-mat depth by pressing thumbnail at increasing depth until reaching firmness.
A practical methodology
The methodology involves identifying thatch, mat and soil layers based on characteristics in Table 1 and measuring the boundaries between these layers in a freshly collected soil profile or core sample (3.9-7.8 inches/9.9-19.8 centimeters deep). Determinations should be made under dry conditions, avoiding excessive rainfall or irrigation in the days leading up to sampling. A soil moisture content of 10%-20% (sandy soil) or 20%-30% (clay soil) is preferred to ensure accurate layer measurement. To enhance visibility of color differences, lightly spray water on the soil profile using a hand sprayer. The steps for identification of layer boundaries are as follows:
Boundary between thatch/mat and soil: After collecting the soil profile, position it horizontally. Place the hook of a tape ruler at the profile’s top edge and pull down gently using moderate force until resistance is encountered (Figure 1). After fixing the ruler, slightly press horizontally with the thumbnail in small steps from the top of the profile downward, until the profile cannot be pressed in anymore (Figure 2) and resistance is encountered. This depth marks the thatch/mat-soil boundary.
Two-layered soil profiles: If the upper homogeneous layer above the soil is either thatch or mat, distinguish them visually (Table 1). Thatch consists mainly of plant biomass, such as leaf residues, crowns, stems and roots, with little to no mineral content showing a loose structure (Figure 3). Mat is composed of primarily decomposed organic material, with visible mineral particles as the major fraction and a denser structure (Figure 4).
Three-layered soil profiles: For profiles with distinct thatch and mat layers above the soil, differentiate them based on structural and textural differences (Table 1), eventually determining color differences between layers using Munsell soil color charts (5). The latter requires some experience. Within the same hue (basic color of the matrix), at least a color distinction between thatch and mat with a minimum difference in value (brightness) and/or chroma (intensity) of 1 point is to be observable (Figure 5). If not, it should be considered to redefine the profile as a two-layered soil profile with either only thatch or only mat. Irregular boundaries may be averaged for measurement.
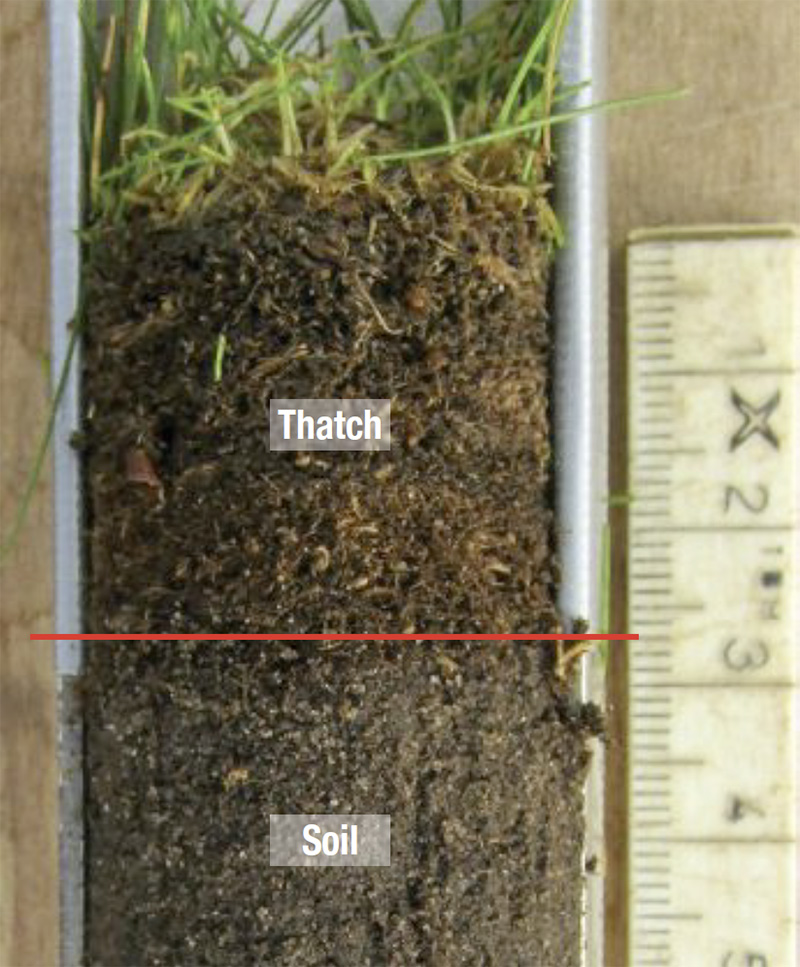
Figure 3. Only thatch.
Validation study
I tested the new methodology on a well-established turfgrass demonstration field with many monoculture plots of turfgrass varieties in the Netherlands (turfgrass seed company DLF) 3.5 years after sowing. The soil was a sandy soil (Hortic Anthraso (FAO/UNESCO soil map)) with an initial organic matter content of 2.6% (loss on ignition), CN ratio of 16 and a pH-KCl of 5.2 (2). Two turfgrass species were selected — slender creeping red fescue (Festuca rubra trichophylla (Frt), variety Beudin of DLF) as an example of a spreading turfgrass, and perennial ryegrass (Lolium perenne (Lp), variety Duparc of DLF) as an example of a bunch-type grass, as these two species were expected to differ widely in thatch and mat depth, as described in Evers (1).
Plots of each species were sampled at the end of February 2020. A subplot of 2.7 square feet (0.25 square meter) in the center of one plot per species was selected, to avoid contamination with other varieties. In the subplot, nine evenly dispersed spots — an adequate number of replicates according to Kaufman et al. (4) — were sampled to 3.9-inch (10-centimeter) depth for thatch-mat and mat-deeper soil boundary observation and total organic matter (TOM) analyses. Every fresh soil sample was judged on thatch-mat and mat-deeper soil boundaries following the methodology as described and then sliced into 14 subsamples of 0.24 inch (6 millimeters) each plus a 0.63-inch (16 millimeter) subsample at the bottom, starting to measure just below the green canopy, for analyzing TOM (loss on ignition) in every subsample.
Based on the analyzed TOM content of the 14 slices per nine replicates, the boundaries of distinctive layers were calculated. Per turfgrass species, the best fitted line and its 95% confidence interval through all normalized TOM results was iteratively calculated by nonlinear least square regression. It resulted in either a logistic function or a bell-shaped Gaussian function as the best fit. Turning points and inflection points of the curves were calculated. The inflection points and turning points indicated changes in TOM content in the turfgrass soil profile as likely boundaries between distinctive soil layers. Differences between mean thatch-mat-soil boundaries observed via the methodology and the calculated thatch-mat-soil boundaries via TOM analysis with mathematical models were checked with a one sample t-test.
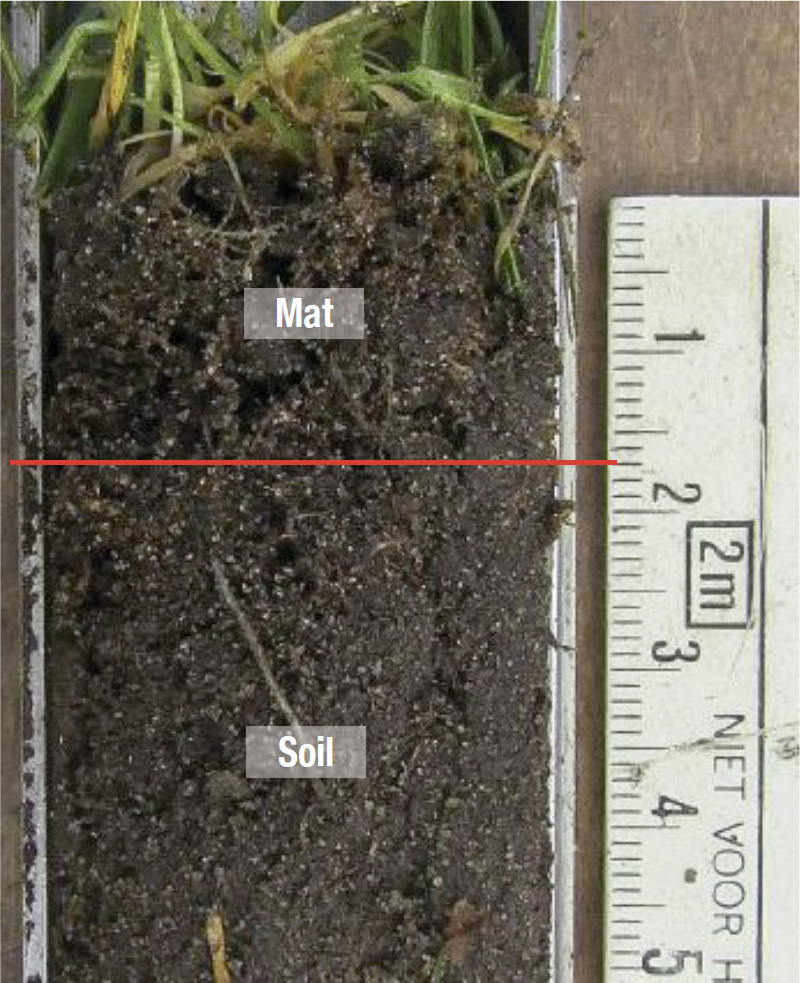
Figure 4. Only mat.
Results
The observed thatch-mat and mat-soil boundaries found in the field for Festuca rubra trichophylla correlated significantly with the two calculated turning points (p < 0.05 = no difference) in the fitted curve (Table 2) for this three-layered soil system. In absence of a thatch layer, the upper 3.94 inches (10 centimeters) of the soil was a two-layered system with Lolium perenne. The mat-soil boundary found in the field correlated well with the calculated inflection point for this species (Table 2).
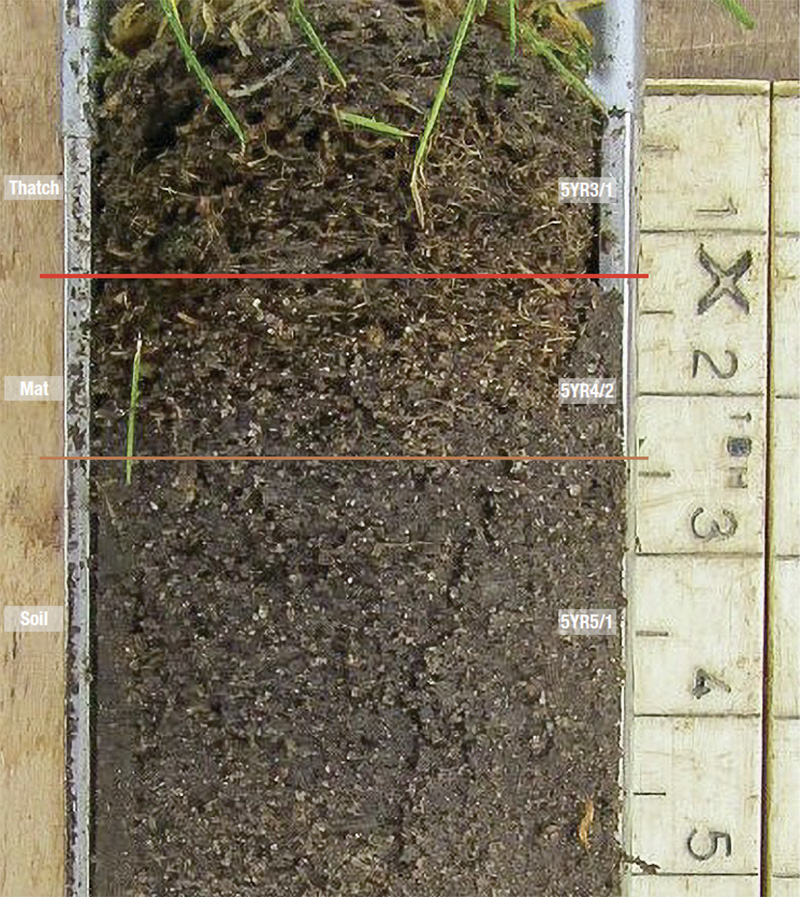
Figure 5. Color distinction in the soil profile according to the Munsell soil color system.
Practical implications
Turfgrass maintenance is primarily focused on creating the best year-round turfgrass surface quality. To achieve this goal, today’s maintenance often requires intensive labor, use of specific machines and equipment, dressing with sand and the use of fungicides and herbicides to control excessive carbon accumulation in the upper inches of a turfgrass soil and its consequences. With an increasing impact of climate change and (upcoming) regulations to decline or ban the use of fertilizers, water or chemical pest control, the turfgrass sector realizes a change in maintenance is needed toward a more ecological and sustainable approach. Aggressive maintenance, such as intensive sand topdressing, hollow tining or scarification, is only needed for thatch control and should be avoided in all other situations. For mat control, less-aggressive maintenance actions, such as light sand topdressing or filming, spiking or solid tining are enough. A thatch mat assessment using the reliable practical method as described helps to choose the correct maintenance actions and can prevent overly aggressive maintenance.
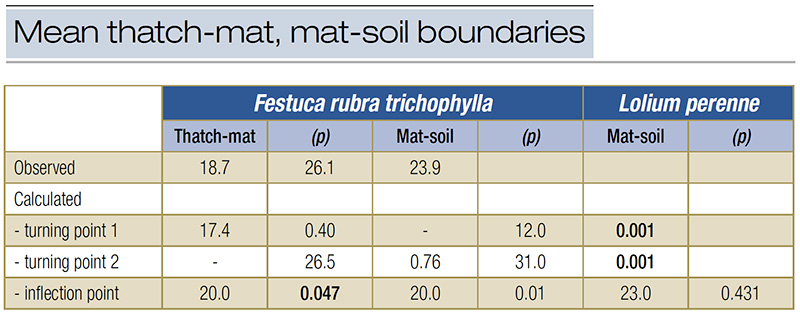
Table 2. Mean thatch-mat and mat-soil boundaries (mm depth) observed in the field, and calculated turning (mm) and inflection points (mm depth) based on mean TOM at various depths for Festuca rubra trichophylla and Lolium perenne, respectively (significant differences (p), calculated with one sample t-test, in bold when p < 0.05).
The research says
- With an increasing impact of climate change and (upcoming) regulations to decline or ban the use of fertilizers, water or chemical pest control, the turfgrass sector realizes a change in maintenance is needed toward a more ecological and sustainable approach.
- Aggressive maintenance such as intensive sand dressing, hollow tining or scarification is only needed for thatch control and should be avoided in all other situations.
- For mat control, less aggressive maintenance actions such as light sand dressing or filming, spiking or solid tining are enough.
- A thatch mat assessment using the reliable practical method as described helps to choose the correct maintenance actions and can prevent overly aggressive maintenance.
Literature cited
- Evers, M., H. de Kroon, E.J.W. Visser and H. de Caluwe. 2020. Carbon accumulation of cool season sports turfgrass species in distinctive soil layers. Agronomy Journal 112(5):3435-3449 (https://doi.org/10.1002/agj2.20231).
- Evers, M., H. de Caluwe, H. de Kroon and E.J.W. Visser. 2024. Validating a practical methodology for thatch-mat-soil distinction in turfgrass soils. International Turfgrass Society Research Journal 1-8 (https://doi.org/10.1002/its2.148).
- Food and Agriculture Organization (FAO). 2006. Guidelines for soil description 4th edition. Publishing and Multimedia Service, Information Division, FAO, Rome.
- Kaufman, J.M., J.C. Sorochan and D.A. Kopsell. 2013. Field sampling warm-season putting greens for thatch-mat depth and organic matter content. HortTechnology 23:369-375 (https://doi.org/10.21273/HORTTECH.23.3.369).
- Munsell Color (Firm). 2010. Munsell Soil Color Charts. Grand Rapids, Mich.
- Schoeneberger, P.J., D.A. Wysocki, E.C. Benham and Soil Survey Staff. 2012. Field book for describing and sampling soils, Version 3.0. Natural Resource Conservation Service, National Soil Survey Center, Lincoln, Neb.
Maurice A.A. Evers graduated in 1993 with a Master of Science in soil science, specializing in soil fertility, at Wageningen University in the Netherlands. In 2025, he successfully defended his Ph.D. thesis: “Below the green carpet: Pedogenesis and carbon accumulation with cool season turfgrass under low input regime” (ISBN: 978-94-6510-436-2) at the Radboud University Nijmegen in the Netherlands. He is CEO and turfgrass agronomist of the Dutch research and consultancy company Lumbricus.