
The latest Golf Course Environmental Profile Survey shows nutrient applications on golf courses have decreased over the past two decades, but rates have stabilized recently. Photo courtesy of J. Bryan Unruh
All living organisms, including the turfgrasses grown on golf courses, require adequate nutrition to survive and persist. When essential nutrients are insufficient, turfgrass growth slows, and plants often exhibit symptoms such as chlorosis, thinning, reduced density, poor recovery from stress and increased susceptibility to pests and environmental extremes. Prolonged nutrient deficiencies can diminish turf quality and playability while weakening root systems and reducing the plant’s ability to withstand the stress imposed by the game of golf. Weakened turf can also lead to elevated nitrogen and phosphorus losses to the environment. Nitrogen is generally the main limiting nutrient in marine and estuarine ecosystems, while phosphorus is most often the limiting factor in freshwater ecosystems.
Conversely, overapplication of nutrients increases management costs without improving turf performance because plants can only utilize a finite amount of nutrients at any given time. Furthermore, excessive nitrogen promotes excessive shoot growth, increases mowing requirements, reduces root development and makes turf more susceptible to certain diseases and environmental stresses. When nutrient supply exceeds nutrient demand, the risk of off-site movement through runoff and leaching can potentially impact surface water and groundwater quality, contributing to environmental concerns such as algal blooms and eutrophication. These concerns have led Virginia and Florida to require golf courses to have nutrient management plans to mitigate nutrient losses to the environment. The goal of a proper nutrient management plan should account for all nutrient sources (e.g., soil available reserves, fertilizer, reclaimed water, compost, amendments, etc.), apply the minimum necessary nutrients to achieve a quality playing surface and apply these nutrients in a manner that maximizes their plant uptake.
Nutrient management is one of the most important components of a comprehensive best management practices (BMPs) program implemented on golf courses. Therefore, assessing nutrient use and management practices are critical to the development, teaching and adoption of BMPs. As part of the Golf Course Environmental Profile Survey Series, GCSAA has been tracking nutrient use and management on U.S. golf courses since 2006. The survey series, now in its fourth iteration, serves as the golf course management industry’s benchmark by providing comprehensive data on environmental stewardship of golf course management. In this article, we summarize the results from the survey on nutrient use and management practices on U.S. golf courses in 2024 and determine what changes have occurred over time.
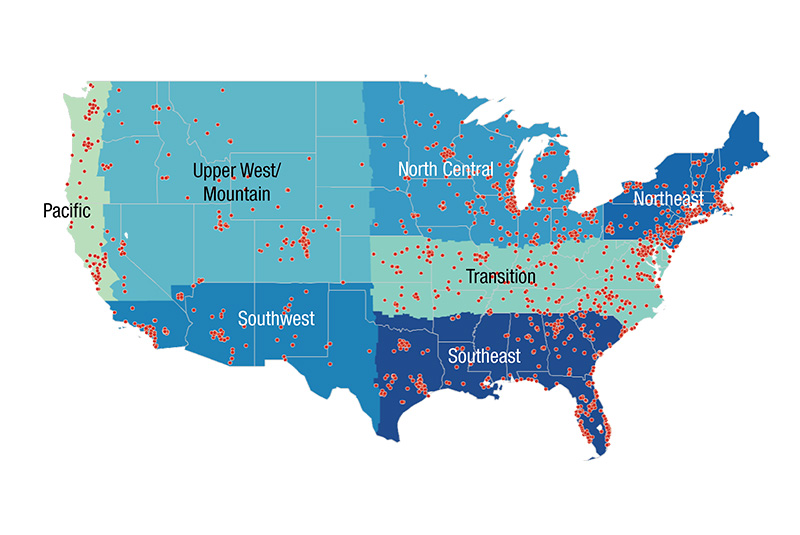
Figure 1. Distribution of the 2024 survey and the seven agronomic regions.
Methodology
An electronic survey instrument was developed with questions that were identical to those used in prior surveys. A survey link was emailed to golf facilities using the mailing lists of the National Golf Foundation and GCSAA, which resulted in the link being sent to 13,952 golf facilities. A golf facility was defined as a business where golf could be played on one or more golf courses. The survey was available for completion for 14 consecutive weeks beginning Sept. 29, 2025. Respondents remained anonymous, and 2024 data were merged with data from the three prior surveys (2006, 2014 and 2021) to allow for a measurement of change over time. Responses were received from 1,499 facilities, which represented 10.7% of the known total of U.S. golf facilities.
Respondents were asked to provide nutrient data according to the guaranteed analysis on the fertilizer label (Association of American Plant Food Control Officials 2017). Therefore, nitrogen, phosphorus and potassium were reported as N, P2O5 and K2O.
Survey respondents were grouped by agronomic region (Figure 1), and the data were statistically weighted to ensure that results accurately represented the U.S. golf course population. Facilities were assigned to one of 35 weighting categories based on facility type (public or private), number of holes (nine, 18 or 27-plus) and public green fee (<$55 or ≥$55 per round), with weighting factors derived from the proportional representation of each category in the national golf course population.
National estimates of nutrient use were calculated by multiplying the number of golf facilities by the proportion of facilities applying nutrients to each course feature and then by the average nutrient application rate for that feature. Projected fertilized acreage was estimated by dividing the total amount of nutrient applied by the average application rate (pounds per 1,000 square feet) and converting the result to acres. Because projected values were derived estimates, statistical mean separations were not performed. To evaluate changes over time, survey years were compared in paired analyses, and differences among comparisons were assessed using chi-square tests with significance declared at the 10% level.
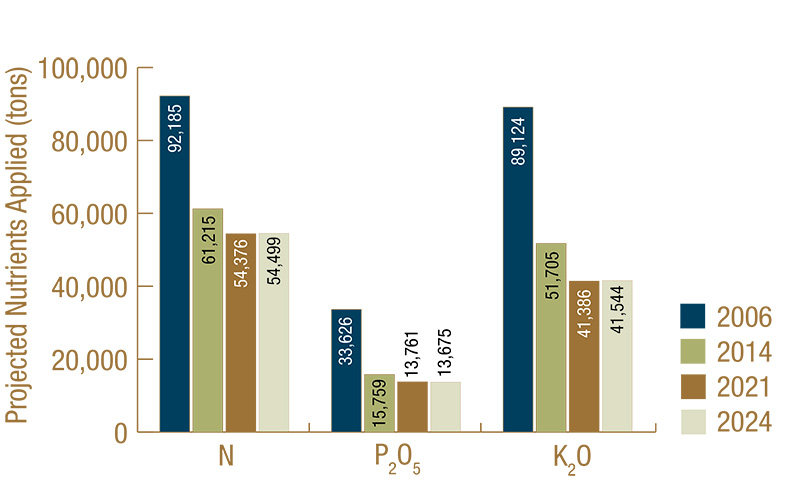
Figure 2. Projected N, P2O5 and K2O applied on U.S. facilities in 2006, 2014, 2021 and 2024.
Results
For nearly two decades, the golf industry has pointed to substantial reductions in fertilizer use as evidence of its commitment to environmental stewardship. Viewed over the full period since 2006, the data tells a compelling story of lower nutrient application rates, fewer fertilized acres and significant reductions in nitrogen, phosphorus and potassium use. However, aggregate statistics can obscure important changes that occur over time. Examining the results over successive survey periods provides insight not only into where the industry has made the greatest progress, but also where the greatest opportunities for future improvement now exist.
Comparing 2006 to 2024&
Since 2006, total projected nitrogen, phosphorus and potassium applications have fallen by 41%, 59% and 53%, respectively (Figure 2), driven by lower application rates, fewer fertilized acres and a 13% decline in the number of operational golf facilities. However, these significant reductions largely occurred between 2006 and 2014.
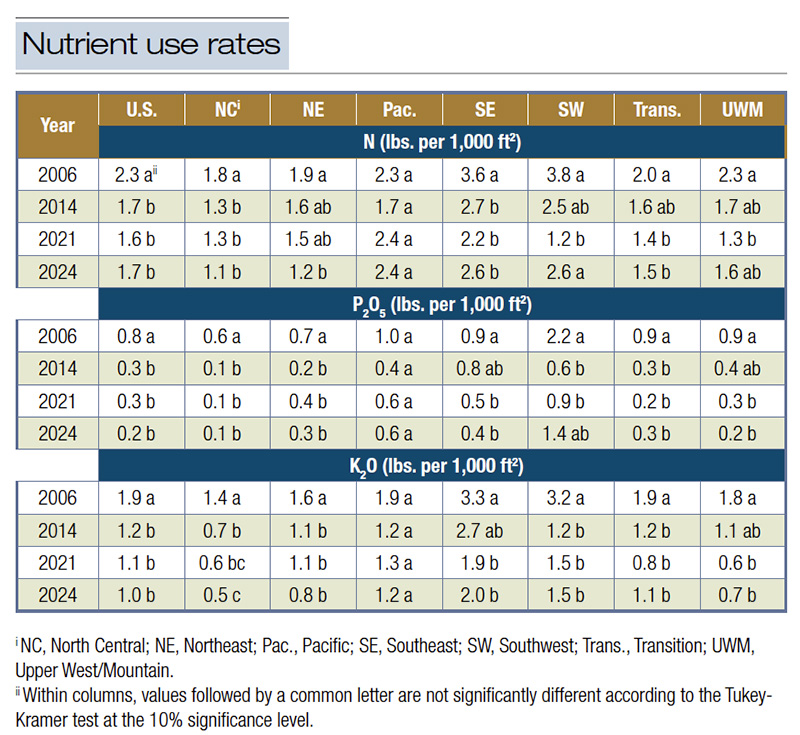
Table 1. Nitrogen (N), available phosphorus (P2O5), and soluble potash (K2O) use rates on golf facilities within the U.S. and regions (Fig. 1) in 2006, 2014, 2021 and 2024.
Rate: Between 2006 and 2014, national nitrogen application rates declined from 2.3 to 1.7 pounds per 1,000 square feet (112.3 to 83 kilograms per hectare), representing a 26% reduction (Table 1). Even greater decreases were observed for phosphorus and potassium, with phosphorus rates dropping from 0.8 to 0.3 pound per 1,000 square feet (39.06 to 14.65 kilograms per hectare) (-63%) and potassium rates declining from 1.9 to 1.2 pounds per 1,000 square feet (92.77 to 58.59 kilograms per hectare) (−37%). These reductions were evident across nearly every agronomic region and marked a significant shift toward lower-input fertility programs. However, changes in fertilizer rates since 2014 have been minimal.
Acreage: Between 2006 and 2021, U.S. golf courses substantially reduced the acreage receiving fertilizer applications (Figure 3). Nationally, acres fertilized with nitrogen declined from 1.18 million to 889,378 acres (−25%), while phosphorus experienced the largest reduction, falling from 1 million to 472,923 acres (−53%). Potassium-fertilized acreage also declined markedly, from 1.13 million to 767,883 acres (−32%). These reductions occurred across every agronomic region, with the greatest proportional decreases generally observed for phosphorus, particularly in North Central (−70%), Northeast (−65%) and Transition (−53%) regions (Table 2).
Median fertilized acreage: At the same time, superintendents have become increasingly selective about where nutrients are applied. From 2006 to 2021, the median number of fertilized acres per golf facility declined from 120.4 to 104.1 acres, a reduction of approximately 14%, potentially reflecting a deliberate effort to focus fertilizer applications on the most intensively managed portions of the facility (Table 3). The reduction in fertilized acreage was not uniform across features. Fairways declined by about 9% (25.6 to 23.4 acres), practice areas by 27% (4.9 to 3.6 acres) and grounds by 35% (1.7 to 1.1 acres). In contrast, rough acreage remained stable at approximately 40 acres per facility, indicating some courses may have already optimized fertilization of roughs or maintained nutrient inputs where necessary for playability. Fertilized acreage on greens and tees increased slightly.
Reasons for the reductions observed between 2006 and 2014 are not clear, as the GCEP surveys ask the “what” questions but not the “why” questions. Some reasonable explanations may include the significant economic downturn in 2008 that led to fewer rounds played with the resultant loss of revenue along with course closures (2). The notable phosphorus reductions may be attributed to focused research and Extension education conducted early in this era (3, 6, 10).
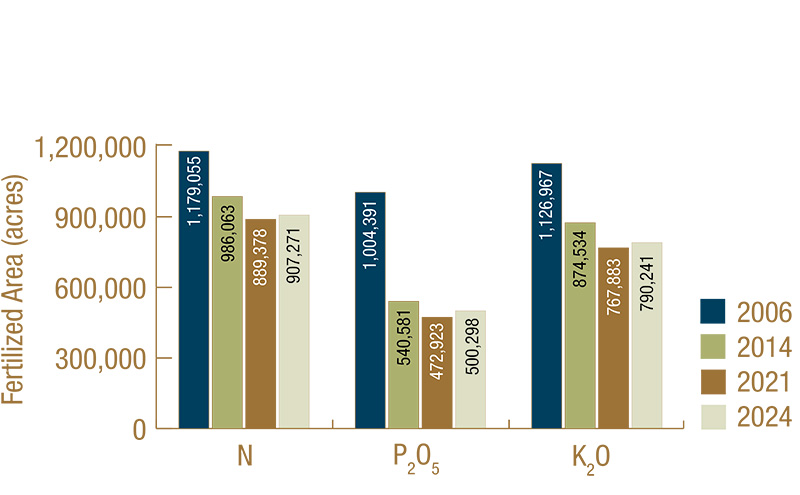
Figure 3. Projected fertilized acres of U.S. golf facilities in 2006, 2014, 2021 and 2024.
Comparing 2014 to 2021
The period from 2014 to 2021 represents a transition from broad reductions in fertilizer use to more subtle changes. Nationally, total projected nutrient use continued to decline, with nitrogen applications decreasing from 61,215 to 54,375 tons (−11%), phosphorus from 15,759 to 13,761 tons (−13%) and potassium from 51,705 to 41,386 tons (−20%) (Figure 2).
Rate: Application rates generally declined or remained stable during this period. Nitrogen use rates saw little change from 1.7 to 1.6 pounds per 1,000 square feet (83 to 78.12 kilograms per hectare), whereas phosphorus and potassium rates continued their downward trajectory as superintendents further refined fertility programs. Greens remained the highest-input surfaces, but fertilizer applications to roughs, grounds and naturalized areas continued to become less common (Table 4).
Acreage: Overall, the 2014-2021 period was characterized by continued reductions in projected fertilized acreage nationwide, particularly for phosphorus. While every region moved toward a smaller fertilized footprint, the largest proportional declines generally occurred in the North Central, Southwest and Upper West/Mountain regions (Table 2).
Median fertilized acreage: Between 2014 and 2021, the median fertilized acreage per golf facility declined nationally from 114.3 to 104.1 acres (−9%), although trends varied considerably among agronomic regions (Table 3). The Southwest experienced the largest reduction, with median fertilized acreage dropping from 171.1 to 89.6 acres (−48%), followed by the Pacific (−37%) and Upper West/Mountain (−16%) regions. In contrast, the North Central region increased from 107.0 to 117.8 acres (+10%), while the Southeast remained essentially unchanged at approximately 108 acres.
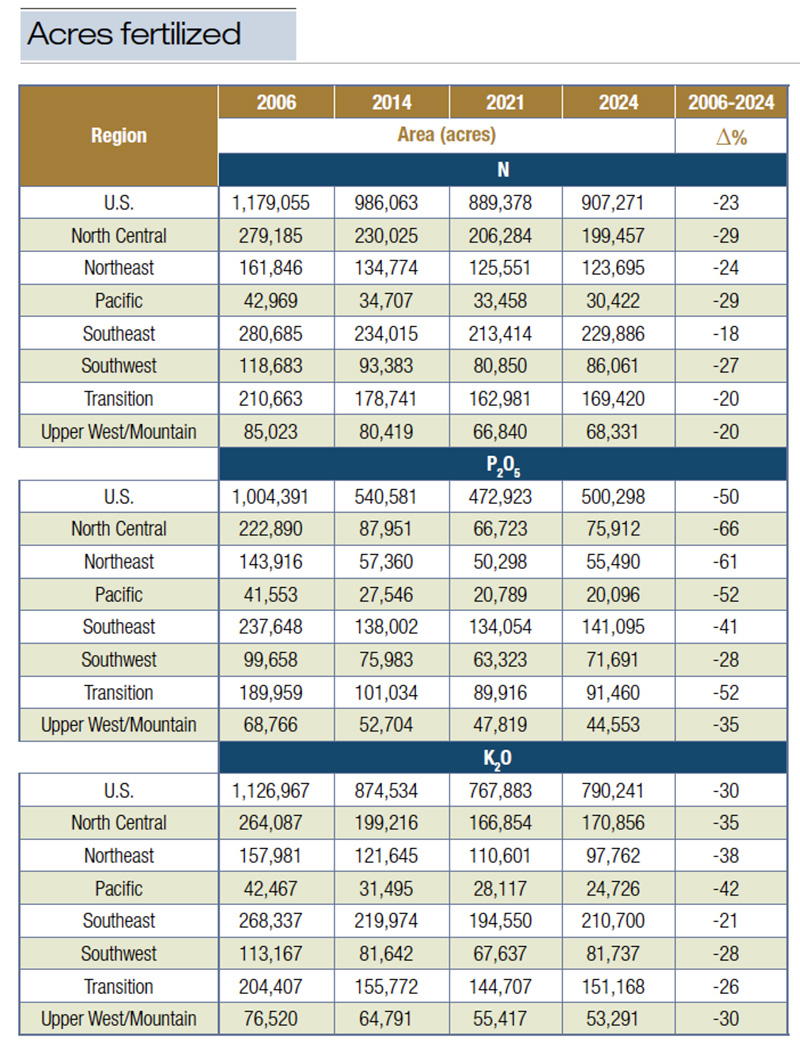
Table 2. Projected acres fertilized with nitrogen (N), available phosphorus (P2O5), and soluble potash (K2O) on golf facilities within the U.S. and regions (Fig. 1) in 2006, 2014, 2021 and 2024.
Comparing 2021 to 2024
In contrast to the years prior to 2021, the period from 2021 to 2024 shows that nutrient management practices have largely stabilized with a modest rebound. Total projected nutrient use, fertilized acreage and application rates changed little at the national level. In recent years, nitrogen use has remained essentially unchanged, while phosphorus and potassium applications exhibited modest fluctuations. Notably, the number of facilities reporting phosphorus applications to greens, tees and roughs increased by 9%, 8% and 20%, in 2024, respectively (Table 4).
Rate: Nutrient application rates across all course features between 2021 and 2024 remained unchanged, suggesting that the industry has reached a period of stabilization after years of reductions. The only notable regional change was in the Southwest, where the nitrogen rate increased significantly (2.6 versus 1.2 pounds per 1,000 square feet; 126.94 versus 58.59 kilograms per hectare) (Table 1).
Acreage: Nationally, nitrogen-treated acreage increased by about 18,000 acres (+2%), from 889,378 to 907,271 acres. Phosphorus-treated acreage increased by approximately 27,000 acres (+6%), whereas potassium-treated acreage rose by about 22,000 acres (+3%). Despite these increases, all three nutrients remained well below 2006 levels (Table 2).
Regional trends were mixed. The Southeast and Southwest experienced noticeable increases in fertilized acreage across all three macronutrients, while the Pacific and Northeast generally continued to decline or remain stable. These patterns suggest that the reductions observed during the previous 15 years had largely plateaued by 2021. Rather than continuing widespread cuts in fertilized acreage, superintendents appear to have adjusted their nutrient programs to meet site-specific agronomic needs, resulting in relatively small adjustments while maintaining the substantial long-term reductions in nutrient use since 2006.
Median fertilized acreage: Between 2021 and 2024, median fertilized acreage changed little at the national level, declining only from 104.1 to 100.5 acres (Table 3). This relative stability suggests that the substantial reductions achieved during the previous 15 years had largely plateaued. Changes by course feature were also small. Numerically, greens and tees continued to show slight increases in fertilized acreage, reaching 2.8 acres and 2.5 acres, respectively, while fairways declined marginally from 23.4 to 23.1 acres and practice areas remained unchanged at 3.6 acres.
The most notable adjustment during this period occurred in roughs, where median fertilized acreage declined from 40.6 to 38.4 acres, and in natural areas, which decreased from 17.3 to 12.9 acres, although regional variability remained high.
Collectively, the 2021–2024 data indicate that nutrient management practices have shifted from broad reductions in fertilized acreage to incremental refinements. Superintendents appear to have reduced nutrient applications to a level that meets their turfgrass quality expectations, with recent changes reflecting site-specific adjustments rather than industry-wide reductions.
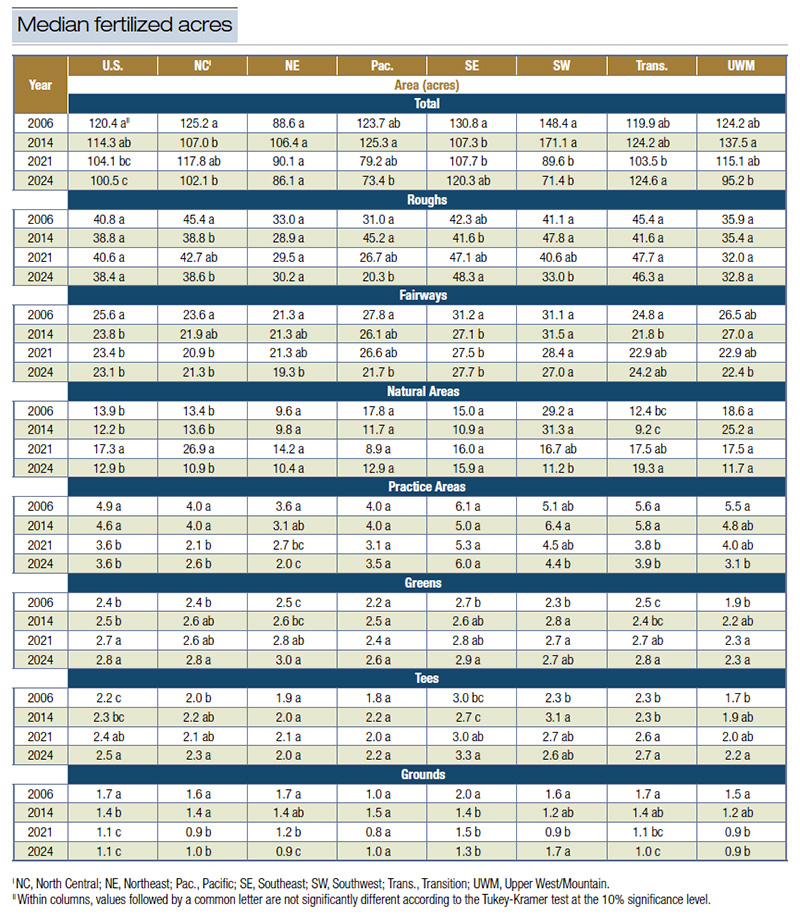
Table 3. Median fertilized acres on golf facilities within the U.S. and regions (Fig. 1) in 2006, 2014, 2021 and 2024.
Written nutrient management plans
A written nutrient management plan provides a structured framework for making consistent, science-based fertilizer decisions that support turf performance and environmental stewardship. Across the U.S., only 42% of facilities reported having a written nutrient management plan, with all regions remaining virtually unchanged since 2006 except for the Pacific Region, where the use of written plans has decreased over time (Table 5). Although state and facility-specific BMP manuals have become increasingly available, they do not appear to have increased the adoption of written nutrient management plans. Greater emphasis should be placed on encouraging the development and implementation of facility-specific nutrient management plans as a practical tool for improving fertilizer efficiency, documenting stewardship and supporting continuous improvement.
As noted, many golf course superintendents in Florida are now required to prepare nutrient management plans with spreadsheet tables showing all facility inputs calculated on a per-acre and per-facility basis. This exercise reveals, perhaps for the first time, the full scale of nutrient inputs, including those from reclaimed water and compost/amendment additions. When aggregated together, the nutrient load numbers are surprisingly large in relation to the pounds-per-thousand-square-feet number often reported.
By documenting nutrient goals, application schedules, nutrient credits from reclaimed water or organic amendments and recordkeeping procedures, these plans help ensure that fertilizers are applied at the right source, rate, time and place. In addition to improving nutrient use efficiency and reducing the potential for off-site losses, written plans facilitate regulatory compliance and support staff training and establish measurable benchmarks for continuous improvement over time.
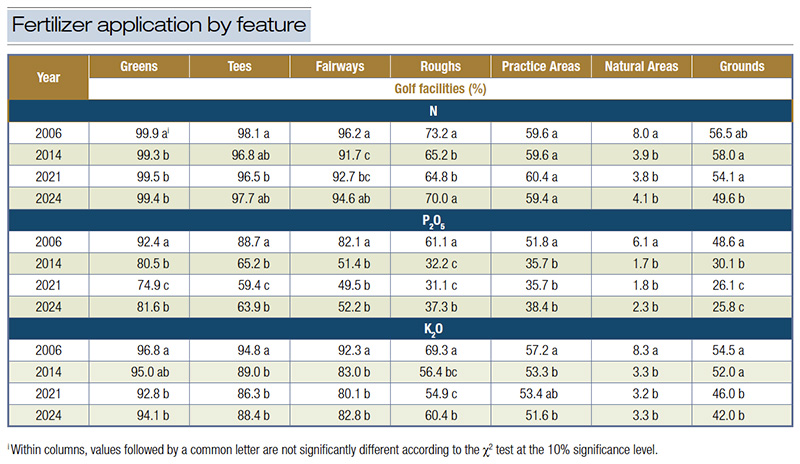
Table 4. Frequency of U.S. golf facilities that reported applications of nitrogen (N), available phosphorus (P2O5), and soluble potash (K2O) to each golf facility feature in 2006, 2014, 2021 and 2024.
Hidden sources of nutrients
An often-overlooked aspect of nutrient management is the contribution of “hidden” nutrient sources that can supply significant amounts of nitrogen and phosphorus not being accounted for in a conventional fertilizer program. Examples include the use of reclaimed water for irrigation, natural organic fertilizers, composts, biosolids, manure-based products and other organic amendments, and background levels of nutrients found in soil and organic matter.
Reclaimed water: When applied over a full growing season, reclaimed water can contribute substantial nitrogen and phosphorus to the turfgrass system. Although nutrient concentrations vary among water treatment facilities and over time, reclaimed water in arid regions commonly contains 2-12 parts per million (ppm) total nitrogen and 0.5-3 ppm total phosphorus (4). Because golf courses in the desert Southwest often apply 3-5 acre-feet of irrigation water per acre annually (9), these concentrations can contribute meaningful nutrient loads. For example, irrigation with 3.5 acre-feet per acre of reclaimed water containing 5 ppm N and 2 ppm P supplies approximately 48 pounds N per acre and 19 pounds P per acre each year, equivalent to about 1.1 pounds N and 0.4 pounds P per 1,000 square feet (53.71 kilograms N and 19.53 kilograms P per hectare) of turf. In Florida, 1-3 acre-feet of irrigation water per acre is applied annually. For a golf course applying 2 acre-feet per acre of reclaimed water containing 5 ppm N and 2 ppm P, approximately 27 pounds N per acre and 11 pounds P per acre would be applied annually, equivalent to about 0.6 pounds N and 0.25 pounds P per 1,000 square feet (29.29 kilograms N and 12.21 kilograms P per hectare) of turf. Routine testing of reclaimed water, combined with site-specific nutrient calibrations that account for these inputs, allows superintendents to credit the nitrogen and phosphorus already being delivered through irrigation. By offsetting these documented nutrient loads against fertilizer program inputs, courses can meaningfully reduce applied nitrogen and phosphorus while still meeting turfgrass quality expectations.
Counterintuitively, survey data revealed that superintendents who account for the nutrients in reclaimed water apply 33% more nitrogen than those reporting that they did not account for the nutrients. Applied phosphorus did not differ between those who accounted for the nutrients in reclaimed water versus those who did not (Table 6). One planning caveat is that the amount of nitrogen and phosphorus supplied by reclaimed water is not necessarily the amount that will be used by plants. There are many factors linked to nutrient use efficiency that should be considered. Regardless, golf course superintendents should recognize that the nitrogen and phosphorus load from reclaimed water is being added to the environment. However, when managed properly, reclaimed water used for irrigating turfgrass is one of the most effective means municipalities have to alleviate the burden of wastewater disposal, as turfgrass is highly efficient at absorbing nitrogen and phosphorus. In this regard, turfgrass provides a valuable ecosystem service by acting as a living nutrient filter.
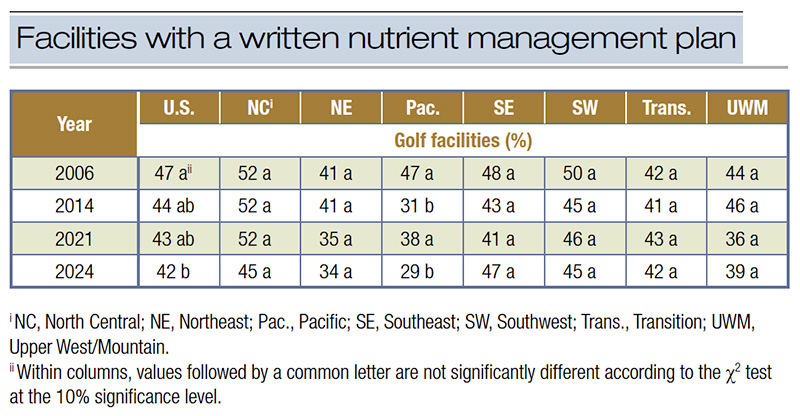
Table 5. Frequency of golf facilities within the U.S. and regions (Fig. 1) with a written nutrient management plan in 2006, 2014, 2021 and 2024.
Soil amendments: The frequency of facilities that applied soil amendments increased for each soil amendment except limestone and calcium chloride (Table 7). Organic soil amendments including composts, biosolids, manure-based products and similar recycled organic materials are used on golf courses to increase turfgrass quality and performance by adding nutrients and by increasing water-holding capacity, particularly in sand-based root zones. Unlike soluble fertilizers, their nutrients are released slowly through microbial decomposition and mineralization, converting organic nitrogen into plant-available ammonium and nitrate, and organic phosphorus into orthophosphate over weeks to months. The quantity and timing of nutrient release depend on the source material, degree of stabilization or composting, carbon-to-nitrogen ratio, environmental conditions and application rate. Consequently, these products can potentially provide meaningful amounts of nitrogen and phosphorus that contribute to turfgrass fertility long after application. However, in recent years, it has been found that some biosolids may contain polyfluoroalkyl substances, also known as forever chemicals (7). Thus, the use of biosolids should take into consideration this potential concern.
Natural organic fertilizers: Golf course superintendents use natural organic fertilizers for a variety of agronomic, environmental and operational reasons. Superintendents use natural organic fertilizers because they provide a slow, sustained release of nutrients, result in a reliable turfgrass response and have little to no risk of burn. These products can also enhance nutrient use efficiency, contribute to sustainability initiatives by recycling organic materials, and complement synthetic fertilizers in integrated fertility programs. However, organic fertilizers supply nitrogen and phosphorus, and both elements need to be accounted for in the overall nutrient budget to avoid unintended overapplication.
For example, when natural organic fertilizers are applied based upon the rate of nitrogen, significant and potentially unnecessary phosphorus applications can ensue. For illustrative purposes, when a 5-2-4 organic fertilizer is applied at 1.0 pounds N per 1,000 square feet (48.82 kilograms per hectare), 20 pounds of fertilizer will be applied per 1,000 square feet. The resultant phosphorus addition from this application is 0.4 pound P2O5 per 1,000 square feet (19.53 kilograms per hectare), which is twice the rate reported to have been applied to golf courses in 2024 (Table 1). Most modern nutrient management programs generally do not recommend routine phosphorus applications to established golf course turfgrass because many soils already supply sufficient phosphorus to meet the turfgrass demand. Instead, phosphorus should be applied only when a visual deficiency is observed or when a soil test using the appropriate extractant and interpretation indicates a deficiency.
Fertilizer filler: Another potential source of unaccounted for nutrients is “filler” in fertilizer blends. Fillers are included in blended fertilizers to ensure the guaranteed analysis is achieved using the specified raw materials. Typically, filler is simply limestone due to its low cost. However, nutrient-containing fillers such as natural organics or biosolids may also be used. When used as filler materials, these organic materials contribute additional nitrogen and phosphorus that are in addition to the guaranteed analysis. Because some fillers supply plant-available nutrients, superintendents should estimate and account for their contributions when developing nutrient budgets and annual fertilizer programs.
Soil nutritional status: Soils contain nutrients, which influence the need to supply nutrients through supplemental fertilizer applications. Soil testing is how soil nutritional status is estimated. Soil testing does not directly measure the total amount of nutrients in the soil. Instead, soil testing provides an index that is correlated and calibrated to a turfgrass response. Soil testing may also evaluate soil properties (e.g., pH, electrical conductivity, cation exchange capacity, percent organic matter) that influence nutrient availability and fertilizer needs. Golf Course Environmental Profile surveys have consistently shown that golf course superintendents who soil-test apply more fertilizer than those who do not soil-test. In 2024, superintendents who soil-test reported applying 22% more N, 27% more P2O5 and 32% more K2O than superintendents who did not soil-test when pooled across all course features (Figure 4). Previous work by Gelernter et al. (1) and Shaddox et al. (8) suggest that the higher application rates associated with facilities that soil-test may reflect interpretations or management philosophies aimed at maintaining nutrient levels above those required for acceptable turf performance. These findings underscore the need for continued research to better calibrate soil-test recommendations with turfgrass response so that nutrient applications optimize performance while minimizing or eliminating unnecessary inputs.
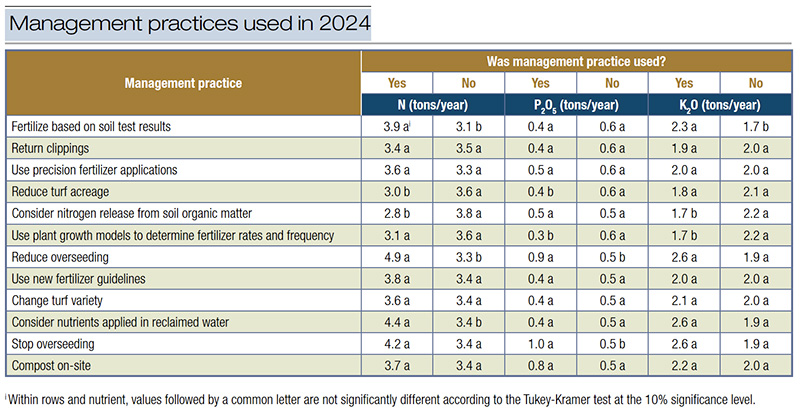
Table 6. Association between management practice used with the intent of reducing reliance upon applied nutrients and median nitrogen (N), available phosphorus (P2O5) and soluble potash (K2O) applied on U.S. golf facilities in 2024.
Interestingly, superintendents who consider nitrogen release from soil organic matter applied 26% less nitrogen than those who did not consider the nutrient contribution from soil organic matter (Table 6). While this is commendable, less is known about actual rates of nutrient release from golf course soils, and evidence-based recommendations are lacking. Of the limited research, model simulations suggest that as the age of the turf stand increases, it may be possible to reduce N fertilization and still maintain acceptable turf quality (5). Site-specific nitrogen calibrations account for the nitrogen contribution from organic matter and would therefore likely result in reducing fertilizer needs without reducing turfgrass performance.
Recognizing and accounting for these “hidden” nutrient sources is essential for developing an accurate nutrient budget and avoiding inadvertent overapplication. Superintendents should routinely test reclaimed water and organic amendments, estimate their nutrient contributions and incorporate those values into annual fertilizer plans. By crediting nutrients supplied from these nontraditional sources, golf courses can reduce purchased fertilizer inputs, improve nutrient use efficiency, lower costs and further minimize the potential for nutrient losses to the environment.
Conclusions and recommendations
The findings from the fourth GCEP nutrient survey demonstrate that the U.S. golf industry has made progress in nutrient stewardship over the past two decades. Since 2006, total projected applications of nitrogen, phosphorus and potassium have declined through a combination of lower application rates, fewer fertilized acres and more selective management of golf course features. However, the data also indicate that the most significant reductions occurred between 2006 and 2014, with nutrient use patterns stabilizing since 2021. This plateau suggests that many facilities have already captured the most readily achievable efficiency gains and that future progress will depend less on simply reducing fertilizer use and more on optimizing nutrient management through precision practices.
The survey results highlight several opportunities for continued improvement. First, greater adoption of written nutrient management plans should be encouraged. Such plans provide a practical framework for documenting nutrient sources, establishing application goals and tracking progress over time. They also facilitate compliance with emerging regulatory requirements and provide an effective mechanism for staff training and continuous improvement. As more states adopt nutrient management requirements or incorporate them into BMP programs, written plans will become increasingly valuable management tools.
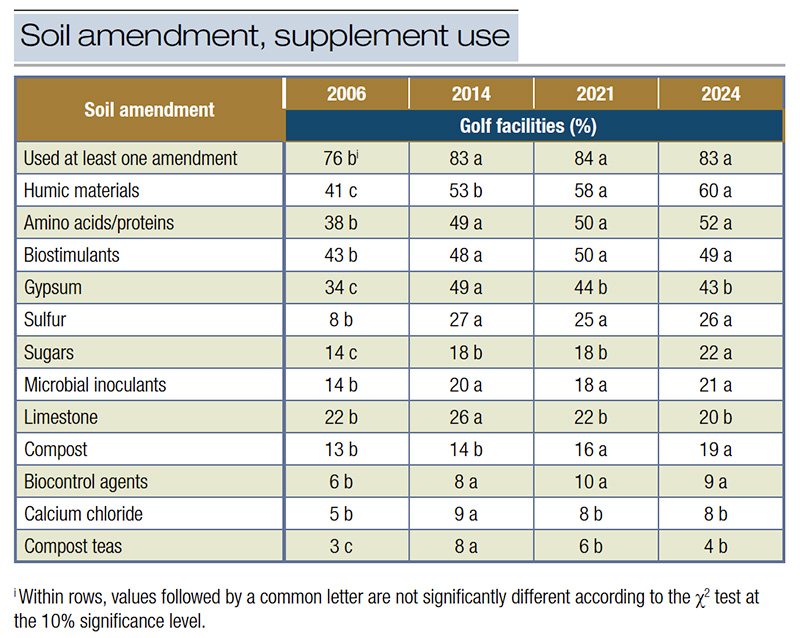
Table 7. Frequency of soil amendment and supplement use on U.S. golf courses in 2006, 2014, 2021 and 2024.
Second, golf course superintendents should place greater emphasis on accounting for all nutrient inputs rather than focusing solely on applied fertilizers. Reclaimed irrigation water, composts, biosolids, manure-based amendments, natural organic fertilizers, fertilizer fillers and nutrients mineralized from soil organic matter may contribute nitrogen and phosphorus to the turfgrass system. Failure to account for these “hidden” nutrient sources may result in unnecessary fertilizer applications and increase the risk of nutrient losses to the environment. Routine testing of reclaimed water and organic amendments, along with nutrient budgeting that credits these inputs, can improve fertilizer efficiency while reducing costs and environmental risk without reducing turfgrass performance.
Third, the industry’s long-term goal should not be to minimize fertilizer use indiscriminately but to apply nutrients as efficiently and precisely as possible to maintain healthy, high-quality playing surfaces. Precision nutrient management supported by evidence-based practices, calibrated equipment, data-driven decision-making and facility-specific nutrient budgets offers the greatest opportunity for future gains. By continuing to refine these practices, golf course superintendents can sustain exceptional turf performance while demonstrating responsible environmental stewardship and protecting surrounding water resources.
The golf industry has made real progress, but the easy gains are behind us. Fertilizer inputs fell sharply after 2006, yet recent data show that nutrient use has largely plateaued, written nutrient management plans remain underused, and many facilities still do not account for nutrient inputs other than from applied fertilizer. The next step is not simply to apply less fertilizer; it is to manage every pound deliberately. Superintendents should develop and use facility-specific nutrient management plans, account for all nutrient sources, calibrate applications to site-specific turf needs, limit fertilization to actively managed areas and expand low- or no-input areas where appropriate. Continued improvement will require moving from broad reductions to disciplined, documented, precision nutrient management.
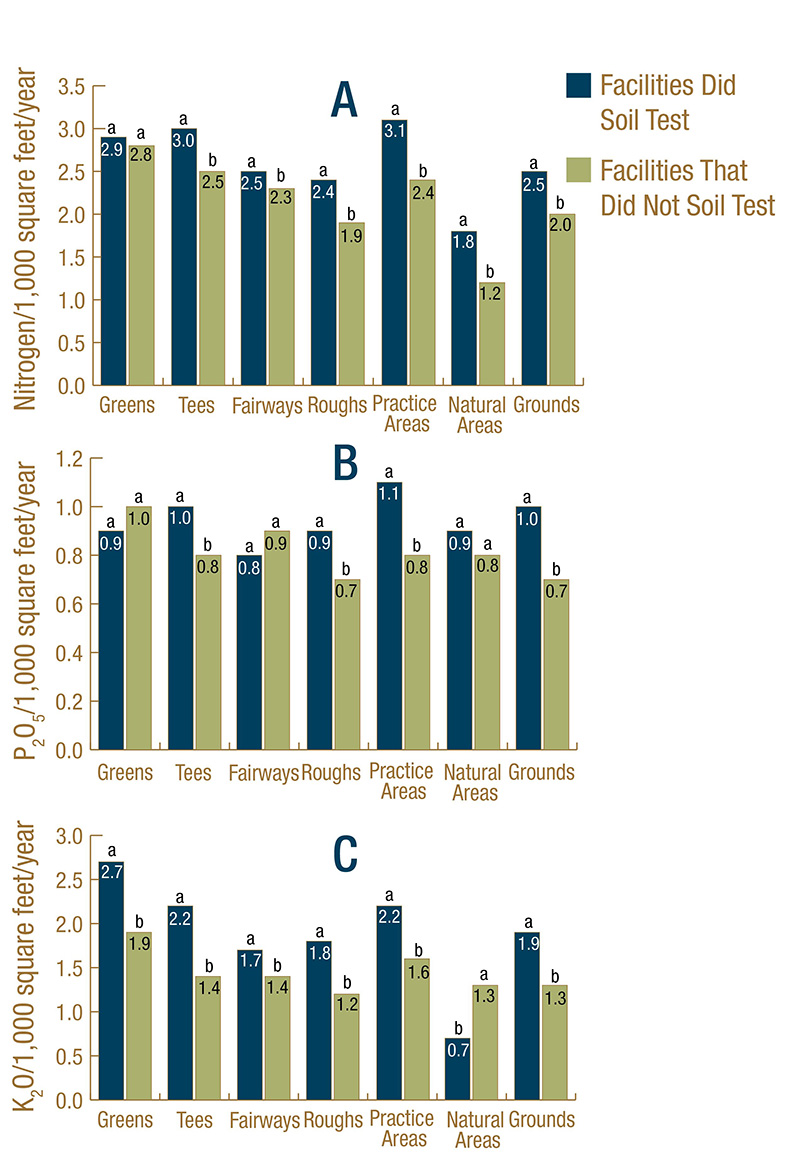
Figure 4. Use rates of A.) nitrogen, B.) available phosphorus (P2O5), and C.) soluble potash (K2O) on U.S. golf facilities that soil-tested or did not soil-test in 2024. Bars with a common letter are not significantly different according to the Tukey-Kramer test at the 10% significance level.
Funding
The fourth phase of the Golf Course Environmental Profile was conducted with funding provided by GCSAA.
The research says
- Create and use a nutrient management plan.
- Account for all nutrient inputs and adjust nutrient applications where applicable.
- Apply nutrients only to actively managed or in-play areas.
- Establish and/or expand low to no-input natural areas where appropriate.
- Calibrate applied nutrients to your site-specific needs.
The next steps
- Stop managing fertilizer. Start managing nutrients. Fertilizer is only one component of the nutrient budget. Reclaimed water, composts, biosolids, natural organic fertilizers, soil organic matter and even fertilizer fillers all contribute nutrients that should be quantified.
- No nutrient management plan? Every golf course should maintain a written nutrient management plan that documents goals, nutrient credits, application decisions and annual results.
- Every pound needs a purpose. Apply nutrients only when there is a documented agronomic need and a reasonable expectation of improving turf performance.
- Measure inputs — not intentions. Estimate annual nutrient loading from known and “hidden” sources before purchasing and applying fertilizer.
- Reduce managed acres before reducing application rates. The greatest future gains may come from shrinking the fertilized footprint rather than pushing already conservative application rates even lower.
- Benchmark your facility every year. Track pounds applied, acres fertilized, nutrient sources and nutrient use efficiency. If you don’t measure it, you can’t improve it.
Literature cited
- Gelernter, W.D., L.J. Stowell, M.E. Johnson and C.D. Brown. 2016. Documenting trends in nutrient use and conservation practices on US golf courses. Crop Forage & Turfgrass Management 2(1) (https://doi.org/10.2134/cftm2015.0225.)
- Golfweek. (2009). US national golf foundation sees only gloom. https://www.top100golfcourses.com/news/us-national-golf-foundation-sees-only-gloom.
- Horgan, B.P., and C.J. Rosen. 2008. Restricting phosphorus fertilizer use: Minnesota superintendents have reinforced their reputations as environmental stewards by working with state and local lawmakers and acting as partners in solving water-quality problems. Golf Course Management 78(2):92-96.
- Parsons, L.R., B. Sheikh, R. Holden and D.W. York. 2010. Reclaimed water as an alternative water source for crop irrigation. HortScience 45(11):1626-1629 (https://doi.org/10.21273/hortsci.45.11.1626).
- Qian, Y., and R.F. Follett. 2002. Assessing soil carbon sequestration in turfgrass systems using long-term soil testing data. Agronomy Journal 94(4):930-935 (https://doi.org/https://doi.org/10.2134/agronj2002.9300).
- Rosen, C.J., and B.P. Horgan. 2005. Regulation of phosphorus fertilizer applications to turf in Minnesota: Historical perspective and opportunities for research and education. International Turfgrass Society Research Journal 10:130-135.
- Saliu, T.D., M. Liu, E. Habimana, F. Fontaine, Q.T. Dinh and S. Sauvé. 2024. PFAS profiles in biosolids, composts, and chemical fertilizers intended for agricultural land application in Quebec (Canada). Journal of Hazardous Materials 480:136170 (https://doi.org/10.1016/j.jhazmat.2024.136170).
- Shaddox, T.W., J.B. Unruh, M.E. Johnson, C.D. Brown and G. Stacey. 2023. Nutrient use and management practices on United States golf courses. HortTechnology 33:79-97 (https://doi.org/10.21273/horttech05118-22).
- Shaddox, T.W., J.B. Unruh, J. Tapp, C.D. Brown, G. Stacey and E. Fuger. 2025. Survey of water use and management practices on US golf courses from 2005 to 2024. HortTechnology 35(5):848-857 (https://doi.org/10.21273/horttech05716-25).
- Soldat, D.J., and A.M. Petrovic. 2008. The fate and transport of phosphorus in turfgrass ecosystems. Crop Science 48(6): 2051-2065 (https://doi.org/10.2135/cropsci2008.03.0134).
J. Bryan Unruh, Ph.D., (jbu@ufl.edu) is a professor and associate center director at the University of Florida, Institute of Food and Agricultural Sciences’ West Florida Research and Education Center in Jay, Fla. Travis Shaddox, Ph.D., is president of Bluegrass Art and Science LLC, Lexington, Ky.