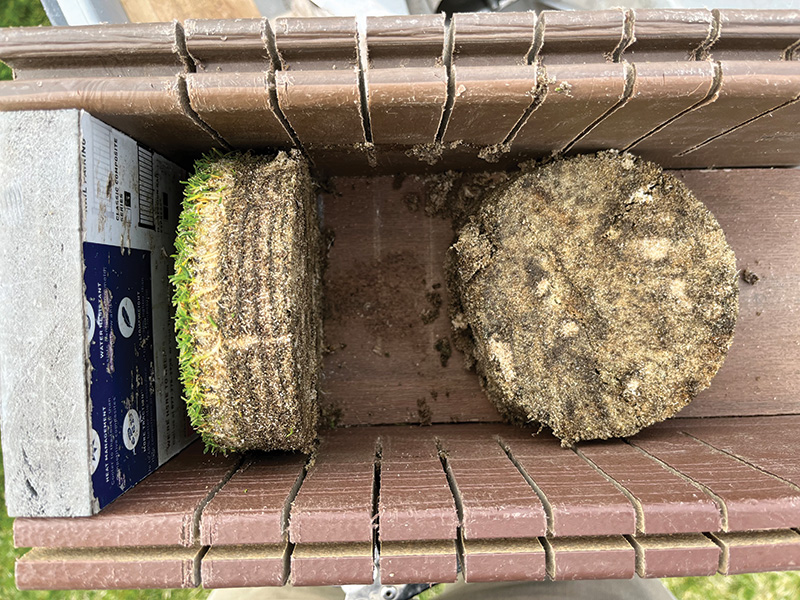
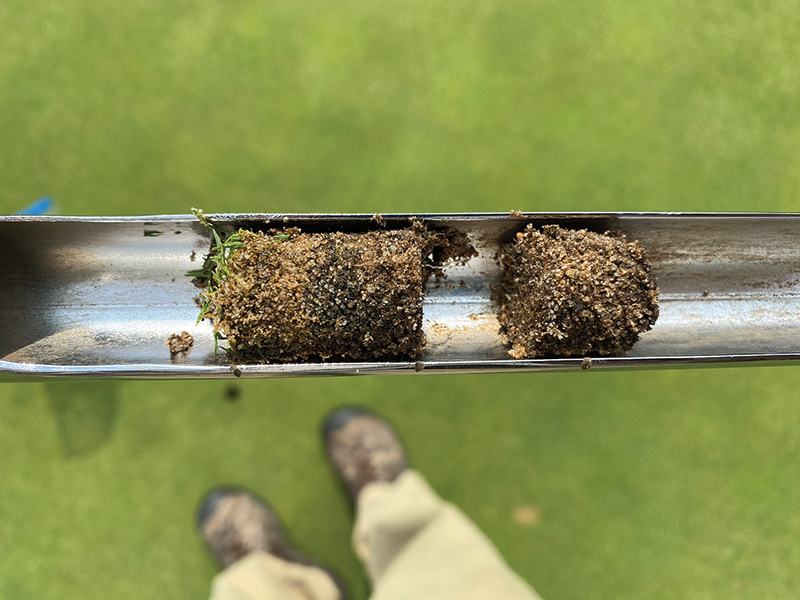
Representative samples are key when it comes to the accuracy of analysis of golf course putting greens. Photos courtesy of Brian Mavis
“Anything worth doing is worth doing right.”
— Hunter S. Thompson
This famous saying surely applies when it comes to proper sampling to ensure accurate data collection on golf courses. Collecting a truly representative sample utilizing the best methods and subjecting those samples to the proper analytical procedures
is a critical step to understanding greens performance and evaluating the effectiveness of cultural practices. If you have been challenged with trying to design or better understand your cultural practices around highly variable and incongruent test
results, then review your sampling procedures. Like soil nutrient samples, more than one core should be collected from a golf course green to obtain accurate and representative data.
The sand, silt, clay, organic matter and sand particle distributions (partial physical analysis) are the “meat and potatoes” of the physical report. If these levels are desirable, then the moisture measurements are most likely going to be
within an acceptable range. Although undisturbed core samples might seem to be the best method of analysis, it is impossible to collect a sample that is truly undisturbed. If small cores are used, then multiple cores will need to be collected to provide
a sufficient sample to meet the requirements for accurate laboratory analysis of factors such as particle size distribution and organic matter content.
In this article, the recommended number of samples, sample size and volume are discussed. Most importantly, I do not recommend the use of a single core per green to be representative of an entire green. In addition, I recommend that percolation rates
be conducted in the field using an infiltrometer because there are no undisturbed samples. There will always be some disruption during sampling, shipping and handling in a laboratory that likely impact hydraulic conductivity. By following the steps
outlined in this article, you can help ensure that you obtain representative samples and accurate data from the laboratory to make management decisions related to root-zone physical conditions.
Organic matter challenges
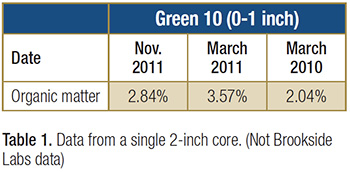
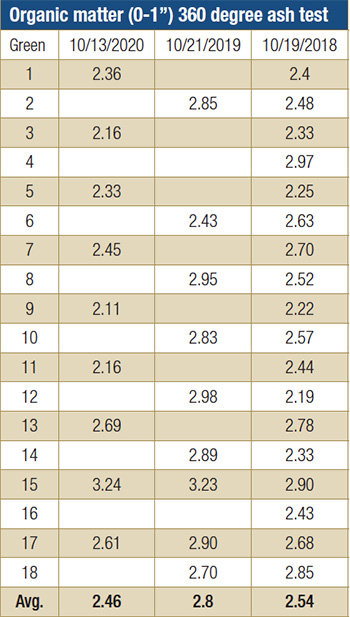
Unexplainable swings in organic matter content from one year to the next or even within the same growing season are common in single core samples (Table 1). There are many ways to sample and analyze organic matter in existing root zones; however, when
done properly, there is typically no more than 0.2% to 0.75% change within 12 months for cool-season turf. Like the USGA quality control confidence interval for organic matter, I suggest that a change of <0.2% is not a significant change, as there
may be this much variability in testing the same sample. If you are seeing changes >1% within a year on mature cool-season putting greens (without highly aggressive cultural practices), then I suggest having the sample rechecked, utilizing a more
representative sampling method or seeking an alternative source for the data.
Infiltration challenges
Infiltration/hydraulic conductivity readings are another parameter that have caused concern for testing accuracy. It is challenging to replicate this “real-world” physical property, but typically when the organic matter increases in a high-sand-content
root zone, the infiltration reading should decrease. Increases in organic matter/thatch reduce macropore space and cause a decline in infiltration (1). Significant fluctuations in infiltration readings have been seen from year to year in single core
samples, and they have shown to decrease significantly when organic matter remains the same or supposedly decreases.
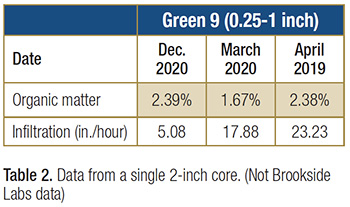
A decrease in thatch/organic matter would normally result in increased infiltration assuming the sand particles and silt/clay levels are constant. Table 2 is an example demonstrating this lack of correlation seen when testing a single 2-inch core. Silt/clay
and sand particle sizes also impact infiltration readings, but these levels have not been significantly different to explain the large swings in infiltration readings of the single core samples.
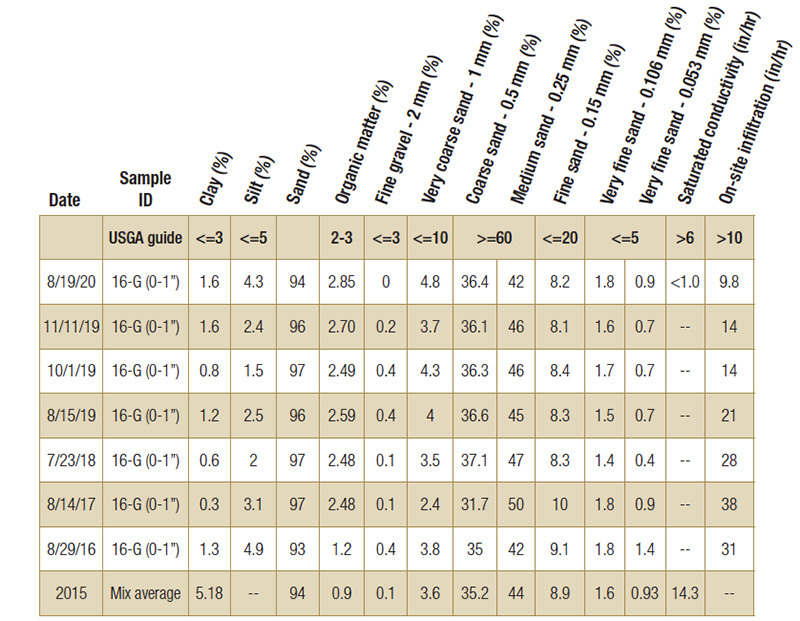
Examples of a complete physical analysis (top) and a partial physical analysis (above). For the complete analysis, submit six cup-cutter sized plugs per area cut into 1-inch increments. For the partial analysis, three to four cup-cutter-sized plugs cut into 1-inch increments will do.
Unfortunately, even in laboratory settings, the Saturated Hydraulic Conductivity (SHC) method utilized for USGA/A2LA testing (ASTM D2434 and ASTM 1815-97) is typically not representative of the in-field percolation rates for a mature upper root zone.
Samples are compacted according to protocol in an effort to simulate on-site conditions. This method works well for samples containing limited silt/clay (<2% combined) and organic matter (<1.5%), but most existing root-zone samples contain >2%
silt/clay and organic matter (turf removed 360 C [680 F]). This results in excessively compacting the samples and greatly reduced SHC compared to on-site readings.
Other test methods such as the drop test (2) in the lab or on-site double ring infiltrometer (Turf-Tec International) readings may be more accurate. On-site readings are subject to variables like soil moisture content, wetting agent applications, recent
cultural practices, etc. However, they are easily rechecked/repeated if there are significant differences from one year to the next. If the single core samples submitted have been dissected, then there is no chance of having those results rechecked.
The drop test can be rechecked at the lab if enough samples have been submitted. Remember that the sand, silt, clay and organic matter percentages, along with sand particle distribution/characteristics, tend to dictate moisture measurements in the
root zone. If these parameters are desirable, then the moisture readings should follow. If you see conflicting results, then it is time to ask for rechecks or utilize another source for your data.
“Data is only as good as the system (or process) that collects it.”
— Anonymous
Sample collection
If your existing root-zone physical data is based on a single core 2 to 3 inches in diameter, then you have most likely seen these significant swings in results. This is especially true if the sample is dissected into 1-inch increments (0 to 1 inch, 1
to 2 inches, 2 to 3 inches, etc.). The data on the small sample may be accurate for that sample, but the sample is most likely not representative of an entire green. Furthermore, a 1⁄2-inch aeration hole filled with sand in a 2-inch core can
have a significant impact on the results as it represents 25% of the sample area.
When submitting samples for USGA/A2LA (American Association for Laboratory Accreditation) testing where results are based on the average of duplicate analysis, a minimum of 0.5 gallons (2,200 grams) of material is required. This amount of sample is needed
to accurately measure the parameters for a complete physical analysis. It is highly recommended to submit extra material if there is a need to recheck any of the parameters. Representative samples for an existing green (approximately 5,000 square
feet [465 square meters]) that you will need to collect depend on the type of analysis being performed:
- Complete physical analysis. Six cup-cutter-sized plugs per area to be sampled, cut into 1-inch increments.
- Partial physical analysis. Three to four cup-cutter-sized plugs per area to be sampled, cut into 1-inch increments. Ideally, these cores would be dissected prior to shipping. If you are submitting the entire core, then secure them in plastic wrap
to retain moisture and keep the cores intact. Be sure to package them tightly.
If your goal is to evaluate organic matter only, then collect 15 soil-probe cores, from 3⁄4 to 1 inch in diameter, cut into 1-inch increments. This can also be substituted with seven plugs 2 inches in diameter or possibly soil profiler plugs 3 inches
wide by 1 inch deep, all cut into 1-inch increments. Again, err on the high side for sample collection to ensure sufficient material for testing and increasing area representation.
The advantage of the soil probe plugs is that they can be easily repaired with a ball mark tool. The depth of layers to be tested and the number of layers can be determined based on site-specific conditions. However, I recommend testing layers no greater
than 1 inch (2.5 centimeters) in depth to detect changes sooner rather than later.
If evaluating organic matter only, a collection of 15 soil-probe cores (0.75-1 inch diameter) cut into 1-inch increments will suffice.
Test time
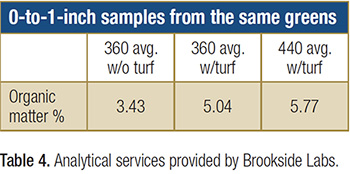
There are numerous physical tests that can be conducted on existing root zones. If testing organic matter only, then the decision needs to be made whether to include the turf in the testing. As expected, there is a significant increase in organic content
if the turf is left on the sample (approximately 1%-2%) as compared to removing the upper 1⁄8 to 1⁄4 of an inch.
To date, I have experienced more variability when including the turf in the testing and results that do not reflect significant changes in cultural practices. However, other independent agronomists are finding that including the turf has been repeatable
and representative. The majority of the samples Mavis Consulting submits for a Soil Profile Assessment (SPA) request the turf be removed from the sample at the lab for these reasons, as well as the ability to analyze sand particle distribution and
moisture measurements. I will continue to evaluate samples where the turf is included in the organic matter analysis.
Table 3. Fifteen soil probe samples (turf removed). Analytical services provided by Brookside Labs.
The next decision is which organic matter test to run (360, 440, 550, 360 and 440, Walkley Black, etc.). The 360 C ash test is utilized to determine organic matter content when conducting USGA/A2LA-accredited root-zone mix testing. Keep in mind that the
USGA confidence interval for organic matter testing is ± 0.2%. Therefore, I would suggest that < 0.2% differences are not significant, especially with organic matter readings > 2%.
The USGA/A2LA accredited 360 C ash test is utilized by Mavis Consulting for SPA samples, the same as greens mix testing, and protocol requires turf to be removed. Average organic matter content in the upper inch ranges from 2.5% to 4.5% when the turf
is removed (cool-season turf). Table 4 indicates the average for some of the possible differences within the same putting greens based on different test methods and whether the turf is removed.
Sand particle size distribution testing seems to be fairly consistent from lab to lab if they utilize the same sieves. Unfortunately, the same sieves are not always utilized, which can add a slight challenge when trying to compare results. Some calculations
may need to be made if different sieves are added or data is reported as a percent retained versus passing to determine if the results are similar. Some industries typically report data as a percent passing, while others like the USGA guidelines utilize
percent retained.
In conclusion
The sand, silt, clay, organic matter and sand particle distributions (partial physical analysis) are the core of the physical report. If these levels are desirable, then the moisture measurements are most likely going to be within an acceptable range.
Keep in mind that when testing mature root zones, the moisture measurements (saturated hydraulic conductivity, moisture retention, air-filled/capillary pore spaces) will most likely not meet USGA guidelines if utilizing the same test methods as new
root-zone mixes (USGA/A2LA). This is due to the higher organic matter (> 2%) of existing root zones that is typically present in the upper profile. However, the information may be useful for yearly comparison, especially if not conducting on-site
infiltration readings.
In summary, ensure that you are collecting representative samples to accurately evaluate existing root-zone physical conditions. If you are tired of trying to design your cultural practices around incongruent results, then review your sampling procedures.
More than one core should be collected from a green to obtain accurate and representative data.
References
- Carrow, R., P. O’Brien and C. Hartwiger. 2002. Why Putting Greens Sometimes Fail. Unpublished manuscript.
- McIntyre, Jakobsen. 2000. Practical Drainage for Golf, Sportsturf, and Horticulture
Brian Mavis (brian@mavisconsulting.com) is an independent agronomist and owner of Mavis Consulting. He led the seminar “Putting Green Physical Properties from Construction to Maintenance” at the 2023 GCSAA Conference and Trade Show in Orlando.