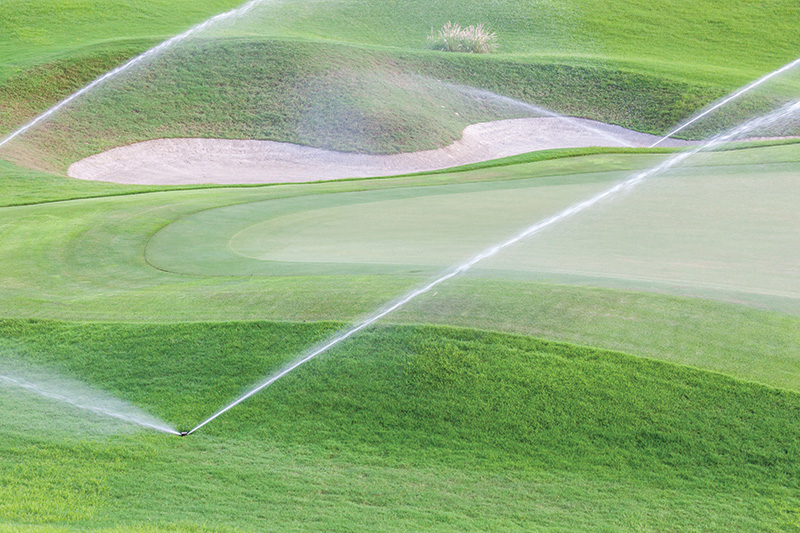
GCSAA’s survey finds courses in the U.S. decreased overall water usage and increased implementation of water best management practices in 2020. Note: Water cost data is no longer available in this series. However, GCSAA refers members to the maintenance budget surveys and reports available at www.gcsaa.org. Photo by mrcmos/Shutterstock
Water Use and Management Practices is the first report of the Golf Course Environmental Profile’s third survey series. GCSAA’s Golf Course Environmental Profile (GCEP) Survey Series, now in its third iteration, serves as the golf course management
industry’s benchmark by providing comprehensive data on the management practices, property features and environmental stewardship of U.S. golf courses.
The GCEP survey series was first launched in 2006 to establish baseline data on issues ranging from land use to regulations and practices governing water use, nutrients and pest control. A subsequent set of surveys were conducted starting in 2014 and
provided scientifically valid measurements of industry change as it related to the five survey topics (Energy Use and Environmental Practices on U.S. Golf Courses, Land Use Characteristics and Environmental Stewardship Programs on U.S. Golf Courses,
Pest Management Practices on U.S. Golf Courses, Nutrient Use and Management on U.S. Golf Courses, and Water Use and Conservation Practices on U.S. Golf Courses).
Results from these surveys are published in Golf Course Management and in online documents (gcsaa.org/Environment/ golf-course-environmental-profile),
and they are frequently used by the GCSAA and other golf-centric organizations to communicate to the public the golf industry’s commitment to environmental stewardship and to promote the efforts golf course superintendents are making on their
golf courses.
Similarly, the GCEP survey data are used to assist in determining the future direction of GCSAA environmental efforts, to identify key issues for potential research projects, to respond to governmental and public inquiries, and to provide a solid basis
for comments on proposed regulatory issues affecting the golf industry.
The GCEP survey results are also published in the peer-reviewed scientific journal Crop, Forage and Turfgrass Management (previously Applied Turfgrass Science), benefiting scientists who routinely use the survey data to guide their research direction
and regulators who must make evidence-based decisions.
The objective of the Water Use and Management Practices Survey was to document water usage on U.S. golf courses in 2020 and to identify potential factors influencing its use and conservation. Data from this survey strengthens the industry benchmarking
process.
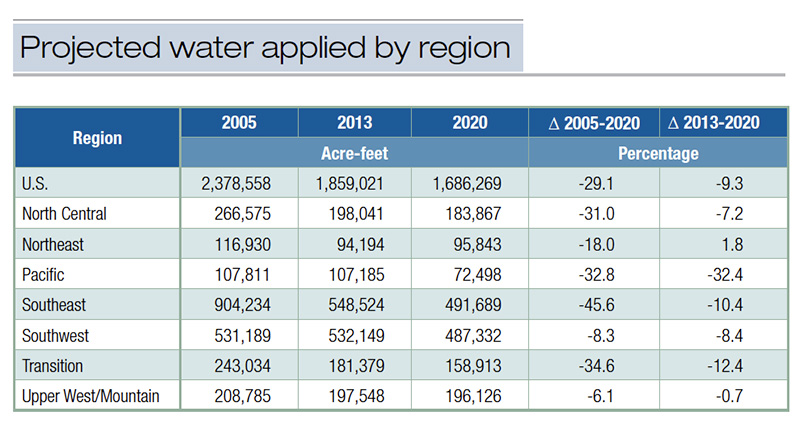
Table 1. Projected water applied to U.S. golf facilities in 2005, 2013 and 2020.
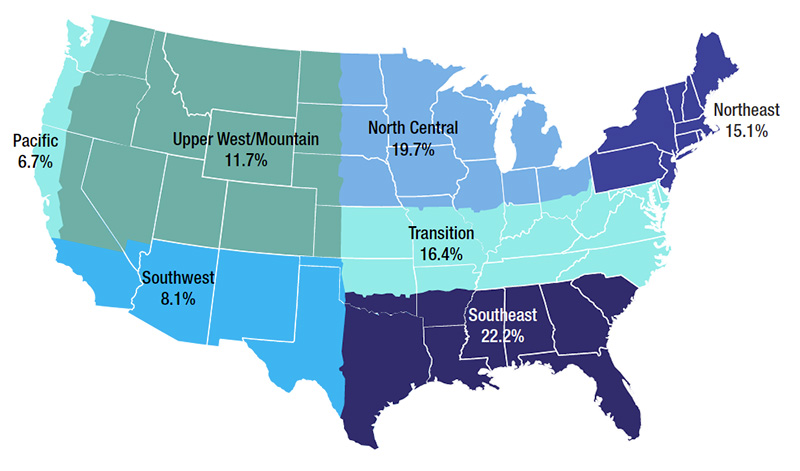
Figure 1. Agronomic regions and proportion of surveys received in 2021.
Methodology
The GCEP third phase/series survey questions mirrored those in the prior two GCEP surveys to maintain survey continuity. Slight changes were made to the questions only to provide clarity where needed.
Travis Shaddox, Ph.D., Bluegrass Art and Science LLC, and J. Bryan Unruh, Ph.D., University of Florida, focused on the scientific aspects of the project, including data analysis and interpretation, and writing the peer-reviewed scientific journal article
and the GCSAA publications. The National Golf Foundation provided oversight of the survey instrument programming, recruited and administered the survey, collated the data, and computed the projected water-use data. GCSAA staff worked closely with
the scientists and NGF to bring the project to completion.
Survey distribution and response: The link to the online survey was distributed by email through the mailing lists of the NGF and GCSAA, which sent the survey link to 14,145 golf facilities (a facility was defined as a business location where golf can
be played on one or more golf courses). Each phase of the GCEP surveys targets the same population; however, the respondents from 2006, 2014 and 2021 are not identical. For ease of comparison and to maintain consistency between surveys, respondents
were classified using the same agronomic regions (Figure 1), facility type (i.e., daily fee, municipal or private), number of holes (i.e., 9, 18 or 27 plus), and greens fee (i.e., < $40, $40-$70, > $70/round).
The survey, promoted on social media platforms and by GCSAA staff, was available for completion for seven consecutive weeks beginning on Oct. 12, 2021. Three email reminders were sent to encourage survey participation and/or completion by those who had
started but not finished. Respondent names were omitted from the data file, and each respondent received a unique identifying number, which provided anonymity within the data file, and only one response was allowed per golf course.
Survey responses were received from 1,575 facilities representing 11.1% of the U.S. total. By comparison, the response rates for the 2014 and 2006 survey were 12.7% and 15.2% respectively.
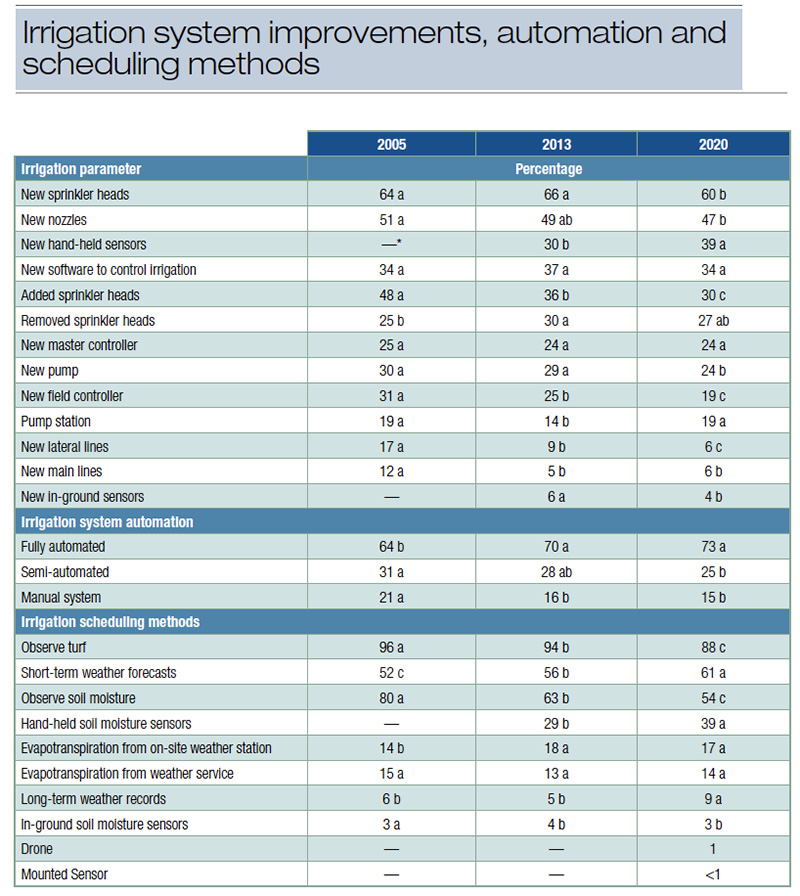
Table 2. Irrigation system improvements, system type and scheduling methods used at U.S. golf facilities in 2005, 2013 and 2020. Note: Within a row, values followed by a common letter are not significantly different according to the chi-square test at the 10% significance level.
*Question not asked in that year.
Data analysis: Survey data were downloaded from the survey software and aligned with data from previous water-use survey data from GCEP Phase 1 and 2 surveys. Prior years’ data were analyzed with data from the 2021 survey allowing for statistical
comparisons between years.
Data were weighted to provide a valid representation of U.S. golf courses and were analyzed using appropriate statistical procedures. Projected water use and irrigated acres were determined by calculating the sum product of the regional water-use means
with the respective number of golf facilities in each region. As a result, statistical separation of projected water use and irrigated acres was not conducted.
Statistical procedures evolve and change over time. Consequently, water use and acreage data from the current and prior two surveys were analyzed using methodology that resulted in minor numeric deviations from previously reported results.
In the current and prior surveys, respondents were asked if they reported water use by using a water meter, estimation or both. As with the prior surveys, responses based solely on estimated water use were omitted from water-use analysis along with variables
that included water use, such as water use per acre.
To provide a relative context of water use, meteorological data were collected from an online database (2) and grouped into agronomic regions using the latitude and longitude of each collection station.
To determine if the percent of respondents engaged in management practices changed over time, years were paired, and differences between all pair-wise comparisons were determined.
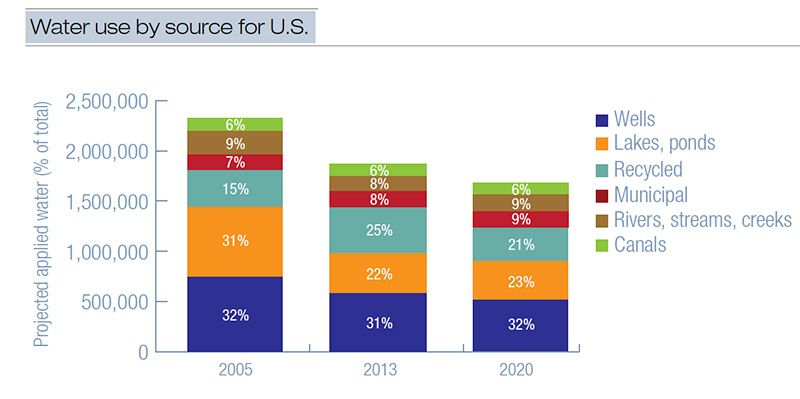
Figure 2. Projected water applied on U.S. golf facilities and percentage of water applied from wells; lakes and ponds; recycled; municipal; rivers, streams and creeks; and canals in 2005, 2013, and 2020.
Results
National summary
Water use
A projected 1.68 million acre-feet of water was applied to U.S. golf facilities in 2020. This represents a 9.3% reduction of applied water since 2013 and a 29.1% reduction since 2005 (Table 1). Median applied water per U.S. golf facility in 2020 was 66.3
acre-feet, which was 23.6% less than that reported in 2005 and equivalent to 2013. Median acre-feet per acre of applied water per U.S. golf facility in 2020 was 1.01, which was 22.9% less than that reported in 2005. Similar to acre-feet, the acre-feet
per acre was also similar to that reported in 2013.
Combined, the Southwest and Southeast regions accounted for 58% of the total applied water in the U.S. in 2020 (Figure 3), which was comparable to 2005 and 2013.
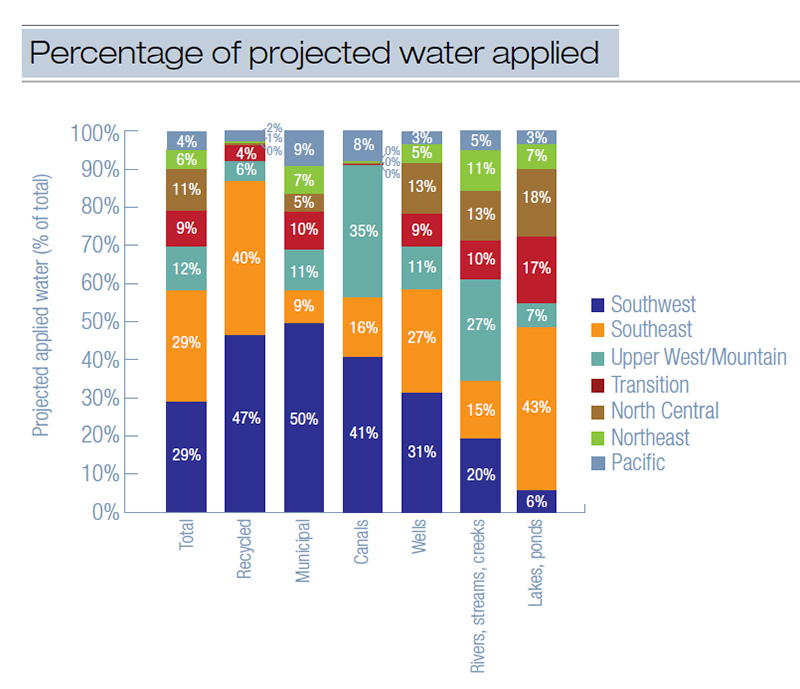
Figure 3. Percentage of projected water applied as total and from recycled; municipal; canals; wells; rivers, streams and creeks; and lakes and ponds in 2020 by agronomic region.
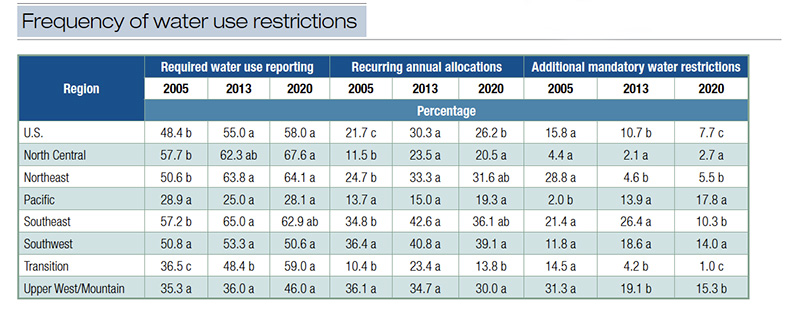
Table 3. Frequency of water use restrictions at U.S. golf facilities in 2005, 2013 and 2020.
Water sources
Since 2005, a reduction in projected applied water was measured within each water source except recycled water, where the quantity of recycled water remained equivalent to that applied in 2005. Generally, the percentage of water applied from canal, river,
municipal or well sources remained unchanged since 2005. The percentage of water applied from lakes and ponds declined, and the percentage of water applied from recycled water increased since 2005. The percentage of water applied from these sources
has remained relatively unchanged since 2013 (Figure 2).
Wells and lakes and ponds supplied 55% of the applied water in 2020; wells and lakes and ponds supplied 63% of the applied water in 2005 (Figure 2). The percentage of golf facilities applying recycled water in 2020 (12.6%) was equivalent to those in 2005
and 2013. The projected quantity of recycled water applied to U.S. golf facilities in 2020 was 351,364 acre-feet and was equivalent to the quantity applied in 2005. Approximately 25% less recycled water was applied in 2020 than in 2013.
The top reason why some U.S. golf facilities did not use recycled water was that there was no source of effluent water (51%), recycled water was unnecessary given other available water sources (31%) or infrastructure to deliver the recycled water did
not exist (14%).
Water scarcity and cost were not major concerns nationally, with 49% and 58% of respondents, respectively, stating they were not worried about either at this time.
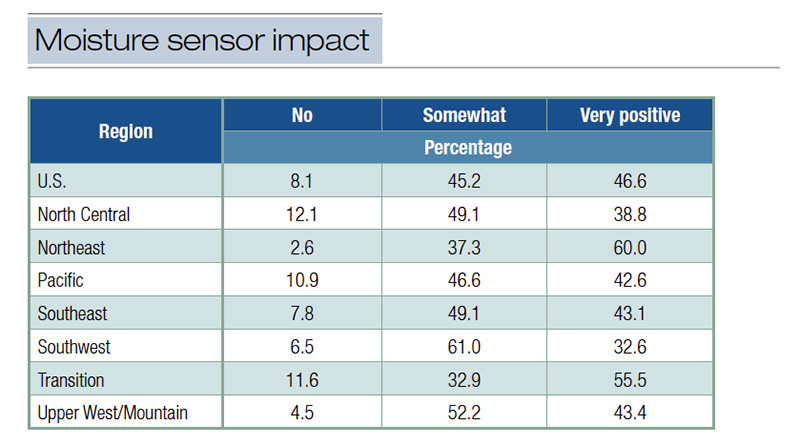
Table 4. Frequency of U.S. golf facilities indicating whether the use of moisture sensors had a positive impact on operations in 2020.
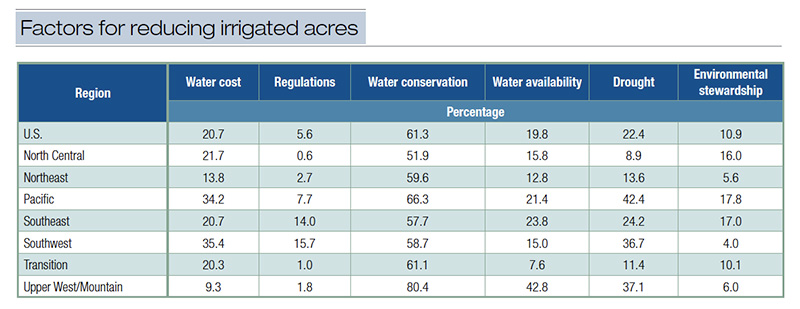
Table 5. Factors motivating the decision to reduce irrigated acres at U.S. golf facilities in 2020.
Irrigated acres
Projected irrigated acres of U.S. golf facilities in 2020 was 1.04 million, which was 11.6% less than that reported in 2005 (Table 9). The median irrigated acres on U.S. golf facilities were 60.9 acres, which was 10.2% greater than that reported in 2005
but equivalent to 2013. The median irrigated acres of roughs, practice areas, greens and tees increased since 2005, whereas irrigated acres of fairways declined by 8.5%, and the irrigated acres of landscape did not change.
Facility influence
The number of U.S. golf facilities declined to 14,145, which was a 11.9% reduction since 2005. The reduction of applied water resulting from facility closures since 2005 was 234,269 acre-feet, which accounted for approximately one-third of the applied
water reductions since 2005 (Table 1). Public and private facilities reported a reduction in applied water per acre since 2005 but applied equivalent water per acre since 2013. Operational golf facilities reduced irrigated acres by 11,423 acres and
applied water by 29,294 acre-feet in 2020.
Management practices
The frequency of most water management practices has increased since 2005. Pruning tree roots and changing to drought-tolerant turfgrass has increased since 2005 and 2013. Management practices that were associated with reductions in applied water included
keeping turf drier than in the past, pruning tree roots, changing to a more drought tolerant turfgrass, mulching landscape beds and increasing no-mow acres.
The use of new hand-held sensors for irrigation system improvements and the use of fully automated irrigation systems have increased to 39% and 73%, respectively, since 2013, but the majority of irrigation system management practices have declined or
remained unchanged since 2005 (Table 2).
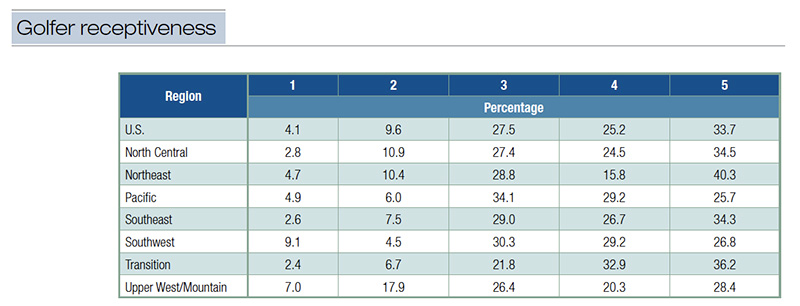
Table 6. Golfer receptiveness resulting from reduced water use and any perceived change in course appearance and playability among U.S. golf facilities that reported a reduction in water use in 2020. Note: Respondents rated golfer receptiveness on a 1-5 scale, where 1 = not receptive at all, and 5 = very receptive.
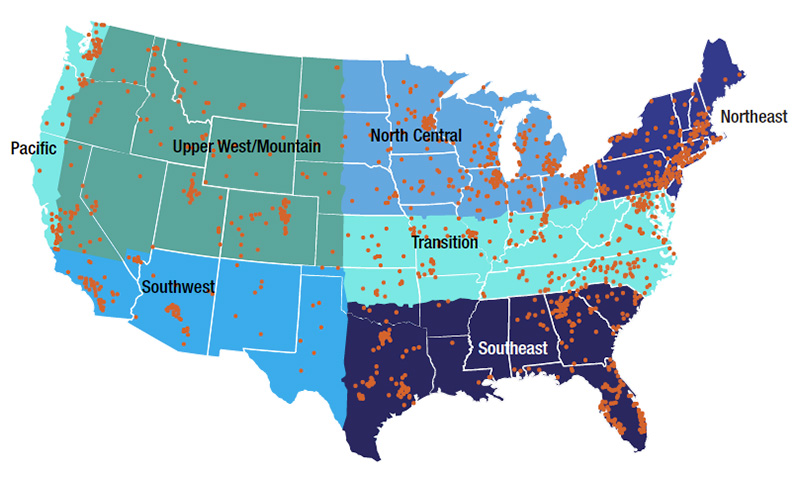
Figure 4. Distribution of 2021 survey responses and the seven agronomic regions.
Regulations
Water use reporting has increased from 48% to 58%, recurring annual allocations has increased from 21.7% to 26.2%, and additional mandatory water restrictions have declined from 15.8% to 7.7% since 2005 (Table 3). Written drought, water, stormwater and
preventative irrigation management plans were uncommon in 2020. However, the majority of facilities that report having a written plan (except for stormwater) do so without being required.
Miscellaneous
Ninety-one percent of facilities reported soil moisture sensors had a positive impact on operations (Table 4), and 61% of facilities that reduced irrigated acres indicated that the decision was based on water conservation (Table 5). Eighty-seven percent
of facilities that reported a water-use reduction also reported that golfers were receptive (respondents answered 3, 4 or 5) to any perceived changes in course appearance (Table 6). Wetting agents (34%) and nutrients (12%) were the most common treatments
used for irrigation injection (Table 8). The COVID-19 pandemic resulted in little to no influence on applied water for most facilities in 2020.
Water testing
Ninety-two percent of facilities had surface water, and 35% of those facilities tested their surface water in 2020, which was equivalent to 2008. Sixty percent of facilities that tested surface water tested their water at least once per year. Of the facilities
that tested surface water, 84% had at least one dedicated monitoring site. Nutrient testing was the most common test conducted (77%) by facilities that tested surface water. Fifty-eight percent of facilities had groundwater wells, and 40% of those
facilities tested their groundwater in 2020. The frequency of groundwater testing declined since 2008.
Of the facilities that tested groundwater, 99% had at least one dedicated monitoring site, and 83% had protected groundwater wells. Forty-two percent of facilities that tested groundwater tested their water once per year; the remaining facilities tested
their groundwater more frequently.
Nutrient testing was the most common test conducted (65%) by facilities that tested groundwater (Table 10). Sixty-two percent of facilities that tested groundwater did not have a dedicated groundwater monitoring site.
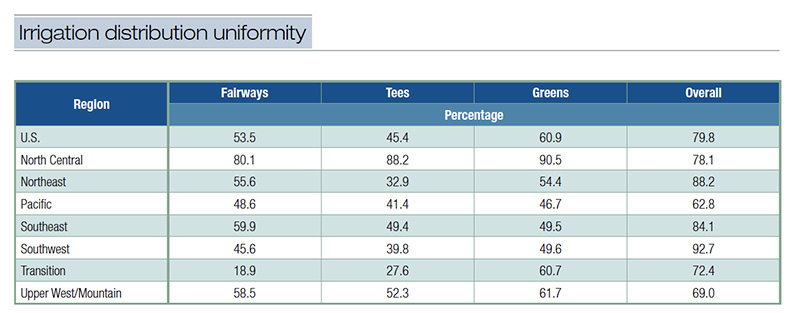
Table 7. Irrigation distribution uniformity on fairways, tees, greens and overall on U.S. golf facilities that conducted an irrigation audit in 2020.
Budget influence
Golf facilities within each budget range reported a reduction in applied water and applied water per acre since 2005 except for facilities with a budget range of $750,000 to $999,999 (Table 11).
Intuitively, nine-hole facilities irrigated the fewest acres, applied the least amount of water and applied the least amount of water per acre compared to 18-hole and 27-plus-hole facilities in 2005, 2013 and 2020.
Regional Summary
Water use
Each region reported reductions in projected applied water since 2005 (Table 1). The greatest percentage and magnitude decrease in projected applied water since 2005 occurred in the Southeast (Table 1). Since 2013, projected applied water in the Northeast
and Upper West/Mountain regions has remained relatively unchanged (Table 1). Median applied water and applied water per acre was greatest in the Southwest, Upper West/Mountain and Southeast regions, which were regions generally associated with low
rainfall and/or high temperatures.
Water sources
The prevalence of facilities using recycled water within each region in 2020 was equivalent to 2005.
The volume of recycled water applied in 2020 was less than that applied in 2005 in each region except in the Southwest and Transition, where applied recycled water increased by 8% and 21%, respectively. The Southwest and Southeast regions accounted for
87% of applied recycled water and 58% of the well water applied in 2020 (Figure 3).
The primary reasons why some U.S. golf facilities did not use recycled water in 2020 were consistent across regions. The most common reason was a lack of available recycled water, followed by recycled water not being necessary and finally some facilities
do not have the necessary infrastructure to deliver the recycled water.
Water scarcity was not a concern for most respondents in each region except the Southwest and Upper West/Mountain regions, where less than 20% of respondents stated there was nothing to be concerned with, but more than 23% stated water scarcity was a
major issue. Water cost was also not a concern for most respondents in each region except the Pacific, Southwest and Upper West/Mountain regions. Fifty percent of the municipal water applied in 2020 was applied in the Southwest region (Figure 3).
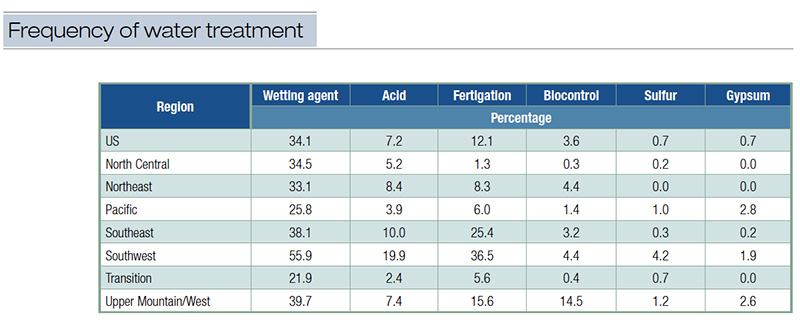
Table 8. Frequency of water treatment used with irrigational systems at U.S. golf facilities in 2020.
Irrigated acres
Projected irrigated acres declined between 2020 and 2005 within each region except the Northeast, which was approximately equal to 2005. Projected irrigated acres declined between 2020 and 2005 at 9-hole, 18-hole and 27-plus-hole facilities.
The Southwest (91.4) and Southeast (87.5) reported the greatest median irrigated acres, which were 150% and 143% greater than the national median. Irrigated rough acres increased in the Northeast, decreased in the Southwest and remained unchanged in other
regions since 2005.
Irrigated fairway acres declined in the Southeast, Transition and Upper West/Mountain regions and remained unchanged in other regions since 2005. Irrigated practice acres increased in the North Central, Southeast and Upper West/Mountain, decreased in
the Southwest, and remained unchanged in the remaining regions since 2005.
Irrigated green acres increased in the North Central, Northeast and Pacific and remained unchanged in the remaining regions since 2005. Irrigated tee acres increased in the North Central and Pacific and remained unchanged in other regions since 2005.
Irrigated landscape acres increased in the North Central, Northeast and Pacific, decreased in the Southwest, and remained unchanged in other regions since 2005.
Course closures
Course closures were greatest in the North Central (535), followed by the Southeast (484) and the Transition (433). The greatest water reduction resulting from course closure was reported in the Southeast (87,217 acre-feet).
Management practices
The most common water management practices in each region were the use of wetting agents, hand-watering and keeping turf drier than in the past. Increasing no-mow acres was associated with a reduction in applied water, but no region reported an increase
in no-mow acres since 2013.
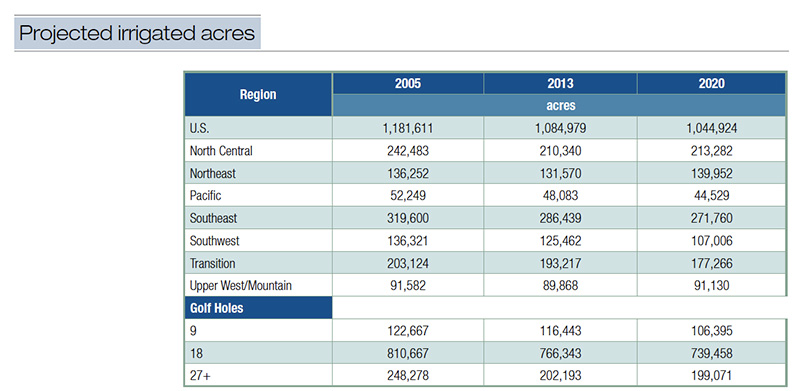
Table 9. Projected irrigated acres of U.S. golf facilities in 2005, 2013 and 2020.
Regulations
Water use reporting increased in the North Central, Northeast and Transition, but remained unchanged in other regions since 2005 (Table 3). While 23% of the U.S. facilities have drought plans, 40% do in the Southwest and 29% do in the Southeast. Other
regions are 20% or less. Nearly 14% of the U.S. facilities have water management plans, while 21% of facilities in the Upper West /Mountain have them. Other regions are lower. Approximately 16% of U.S. facilities have a stormwater plan, while 31%
of the facilities in the Southwest have them. Other regions are lower.
Also, 15% of U.S. facilities have preventive irrigation maintenance plans, while 25% of the Southwest region facilities have them. Other regions are lower. The majority of facilities in each region do not typically have written drought, water, stormwater
or preventative irrigation management plans. Facilities within each region consistently reported a positive impact resulting from the use of soil moisture sensors (Table 4). Among facilities that reduced irrigated acres, water conservation was the
most common reported reason. The percentage ranged from 80% in the Upper West/Mountain to 53% in the North Central region (Table 5).
Miscellaneous
Facilities within each region reported that golfers were consistently receptive to any perceived changes in course appearance resulting from a reduction in applied water (Table 6). Receptiveness ranged from 75% in the Upper West/Mountain to 91% in the
Transition region. Wetting agents were the most common irrigation injection treatment within each region. Nutrients were the second most common injection treatment in the Pacific, Southeast, Southwest, Transition and Upper West/Mountain, while acid
injection was the second most common in the North Central and Northeast regions (Table 8).
Water testing
The prevalence of facilities that had surface water declined since 2008 in the Transition region but remained the same in each remaining region. The prevalence of facilities that had surface water and tested their surface water declined since 2008 in
the Pacific and Upper West/Mountain regions. Otherwise, the prevalence did not change since 2008.
In 2020, surface water testing was most common in the Southwest (51%) and least common in the North Central (26%). Forty-eight percent or more of golf facilities that tested their surface water did so at least once per year, with 45% of facilities in
the Southwest testing their surface water monthly. Of the golf facilities that had surface water and tested their surface water, the most frequent number of surface water monitoring sites was one. In general, the most common variable tested in surface
water within each region was nutrients, followed by oxygen and bacteria.
The prevalence of groundwater wells did not change since 2008 except for a decline in the North Central region. The prevalence of facilities that had groundwater wells and tested their groundwater declined since 2008 within each region except for the
Southwest and the Upper West/Mountain regions, which did not change since 2008. Facilities that tested groundwater ranged from 24% in the Pacific to 51% in the Southwest.
Of the golf facilities that had groundwater wells and tested their groundwater, the most frequent number of groundwater monitoring sites and protected groundwater wells was one. Between 36% and 54% of facilities that test groundwater tested their groundwater
at least once per year.
Generally, the most common variable tested in groundwater within each region was nutrients, followed by bacteria (Table 10). The majority of facilities that tested groundwater in 2020 did not have dedicated groundwater monitoring sites.
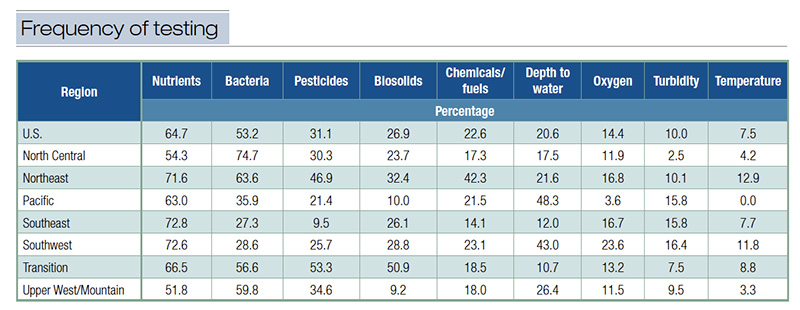
Table 10. Frequency of U.S. golf facilities that tested ground water and tested for the listed variable in 2020.
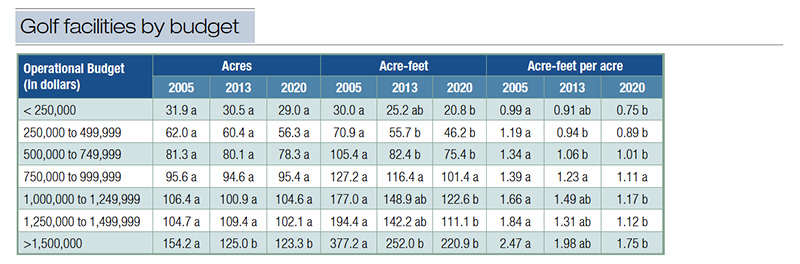
Table 11. Median acres, acre-feet, and acre-feet/acre of U.S. golf facilities in 2020 by budget. Note: Within rows, medians followed by a common letter are not significantly different according to the Tukey-Kramer test at the 10% significance level.
Conclusions and recommendations
Water applied to U.S. golf courses has declined by 29% since 2005 to 1.68 million acre-feet per year. Of that amount, approximately one-third was likely due to course closures, with the remaining two-thirds due to other factors.
A major contributing factor was likely the more efficient use of applied water, a postulation supported by the 23% reduction nationally in water applied per acre.
Recycled water: 87% of recycled water on U.S. golf facilities was applied in the Southeast and Southwest. Recycled water can be challenging to acquire due to the unique infrastructure requirements that are normally beyond the control of the golf facility.
However, where recycled water exists, golf facilities are encouraged to reach out to their local municipalities to determine if recycled water can be conveyed into their facilities.
Irrigated acres: The median irrigated acres of U.S. facilities increased since 2005 in each area of the course except fairways and landscapes. The primary area contributing to the national increase was roughs, which increased by 3.4 acres. If expansion
of roughs is desired, educating players of the playability of nonirrigated roughs may allow for this expansion without increasing irrigated acres.
Management practices: Of the management practices documented, keeping turf drier, pruning tree roots, changing to a more drought-tolerant turfgrass, mulching landscape beds and increasing no-mow acres were significantly associated with reductions in applied
water. Thus, facilities that include these management practices in their program may realize a water savings. Golf facilities should maintain their Best Management Practices manual and strive for continuous improvements with water management. Water
management plans are an important aspect of BMPs as well as water quality testing. Visit www.gcsaa.org for more information.
Educational planning: Strategic educational efforts may be most effective if the following recommendations are implemented. First, the percentage of total water applied to U.S. facilities allocated by regions shows that 58% is applied within the Southeast
and Southwest, whereas the remaining 42% is split between the remaining five regions. Thus, the total applied water shown in Figure 3 may be used as an indicator where to allocate educational efforts to have the greatest impact on national water use.
Second, 18-hole facilities account for 70% of irrigated acres and applied water, with 9- and 27-plus-hole facilities accounting for approximately 10% and 20%, respectively. Therefore, educational resources may be most efficient if allocated accordingly.
And lastly, median irrigated acres have increased since 2005, including areas of the course that may be managed to acceptable levels without being irrigated, such as roughs. Promoting case studies of courses that have successfully maintained or even
increased nonirrigated acres without impacting the golfer’s perception of the course may play a key role in other facilities adopting this approach.
Significant differences
Throughout this report, some tables and graphs contain letters such as a, b or c next to numeric values. These letters indicate whether the values being compared are different. Values followed by a common letter are not different at the 90% confidence
level. This means that when we state that two values are different, we are 90% confident that the true values differ.
Irrigation audits and efficiency
Irrigation distribution uniformity is a common efficiency irrigation test related to the distribution and/or pattern of water on a golf course feature. This is not a test where 100% is realistic but helps with water management in light of constant improvement.
For all courses that conducted irrigation audits across the region’s values range (Table 7):
- Overall — U.S. average was 80%, ranging from 93% in the Southwest to 63% in the Pacific regions.
- Fairways — U.S. average was 54%, ranging from 80% in the North Central to 19% in the Transition regions.
- Tees — U.S. average was 45.4%, ranging from 88% in the North Central to 28% in the Transition regions.
- Greens — U.S. average was 61%, ranging from 91% in the North Central to 47% in the Pacific regions.
Applied water units — what do they mean?
- Applied water is reported in three units — projected applied water in acre-feet, median applied water in acre-feet and median applied water in acre-feet per acre. An acre-foot of water is one foot of water applied to one acre and is equal to
325,851 gallons.
- Projected applied water (national and regional) is the sum product of the average amount of water applied to a 9-, 18- or 27-plus-hole facility using the known number of 9-, 18- or 27-plus-hole facilities within each region. It is an estimate of the
total volume of applied water.
- Median applied water is the median water applied to a golf facility regardless of the facility’s irrigated acres. It is the amount of water where half of golf facilities apply more, and half apply less.
- Median applied water per acre is the median water applied to a golf facility divided by the facility’s irrigated acres. It is an estimate of the efficient use of water and allows for a commensurable comparison of applied water across facilities,
regions, etc.
Literature cited
- Arguez, A., I. Durre, S. Applequist, R.S. Vose, M.F. Squires, X. Yin, R.R. Heim and T.W. Owen. 2012. NOAA's 1981–2010 U.S. Climate Normals: An Overview. Bulletin of the American Meteorological Society 93(11):1687-1697 (https://doi.org/10.1175/bams-d-11-00197.1).
- National Oceanic and Atmospheric Administration. 2022. U.S. Climate Normals. National Centers for Environmental Information. https://www.ncei.noaa.gov
Travis Shaddox, Ph.D., is president of Bluegrass Art and Science LLC. J. Bryan Unruh, Ph.D., is a professor and associate center director at the University of Florida, Institute of Food and Agricultural Sciences’ West Florida Research and Education Center in Jay, Fla.