Significant efforts by turf breeders have led to the development of improved species and varieties of grasses with higher germination rates and adaptive physiological characteristics (1). Current availability and demand for these grasses will only increase their seed prices. Because renovation often entails complete conversion (2) to a single desirable grass, the need to identify cost-effective, optimal creeping bentgrass (Agrostis stolonifera) seeding rates is a major challenge faced in costly renovation projects (8). This is especially true after the bitter winter of 2013-2014, when numerous Midwest and northern golf courses lost putting green turf (Poa annua) to winterkill (3,5).
Evidence suggests that using higher-than-recommended seeding rates to quickly establish putting greens, to thwart weed competition and to minimize disruption of golf rounds played in the first year after renovation, inherently exacerbates plant health issues, and disrupts early-season play of golf rounds (4). Although speedy establishment can mitigate costs and revenue loss, the ability of turf with excessively high shoot density to withstand traffic is uncertain. These concerns could be addressed by using improved creeping bentgrass varieties at, or near, the lower range of the recommended seeding rates of 7.9 to 16.0 ounces/1,000 square feet (2.4-4.9 grams/square meter) (6). The objective of this study was to evaluate the effects of various seeding rates and traffic simulations on the establishment of a sustainable putting surface following renovation.
Materials and methods
Field research was initiated at the Hancock Turfgrass Research Center at Michigan State University, East Lansing, Mich., Aug. 8, 2012, and replicated Aug. 16, 2013. The experimental site was a putting green with high sand content. Before seeding, the existing sward of creeping bentgrass and approximately 3 inches (7.62 cm) of root-zone material were removed and then back-filled with a USGA-recommended putting green root-zone medium made up of 95% sand (0.05-2.0 mm) and 5% silt (0.002-0.05 mm) and clay (< 0.002 mm) (MSU Soil and Plant Nutrient Laboratory, East Lansing, Mich.).
After the root zone was leveled and compacted, a starter fertilizer, 18-24-12 N-P-K (Lesco, John Deere Landscapes), was applied at a rate of 43.7 pounds P2O5/acre (49 kg/hectare), and a poly-coated fertilizer, 43-0-0 N-P-K (Harrell’s LLC), was applied at 65.1 pounds nitrogen/acre (73 kg/hectare) before seeding.
The experiment was a strip-plot, randomized complete block design with V8 creeping bentgrass (Agrostis stolonifera L.) seeded at six rates (1.9, 3.9, 7.9, 12.1, 16.0 and 32.1 ounces/1,000 square feet; 0.6, 1.2, 2.4, 3.7, 4.9 and 9.8 grams/square meter). Four traffic simulation treatments, including a control, were initiated in May, June and July, and each one was replicated eight times.
Normalized difference vegetation index (NDVI) and shear vane strength were measured. Whole plots were 6 feet × 7.8 feet (1.8 meters × 2.4 meters) in 2012-2013, but downscaled in 2013-2014 to 3 feet × 7.8 feet (0.9 meter × 2.4 meters). Subplots (traffic simulation) were 2 feet × 6 feet (0.6 meter × 1.8 meter) in 2012-2013, and 2 feet × 3 feet (0.6 meter × 0.9 meter) in 2013-2014.
After sowing, the seedbed was covered with a spun-cotton germination blanket (A.M. Leonard Horticultural Tool and Supply Co.), which was removed seven days later. Once established, the putting green was mowed five times weekly at 0.118 inch (0.3 cm) fertilized biweekly with approximately 4.46 pounds nitrogen/acre (5 kg/hectare), and received monthly applications of a systemic fungicide. Sand topdressing was applied weekly on a light, frequent basis from May to September in order to simulate golf course putting green practices. When there was no rain, 0.177 inch (0.45 cm) of water was applied to the area daily in three irrigation intervals.
Wear tolerance

Traffic simulation was carried out with a modified reel mower fitted with an aluminum cylinder studded with plastic golf shoe cleats. Photos by Thomas O. Green
In order to assess wear tolerance, all treatments were trafficked with a modified Jacobsen PGM 22 walk-behind reel mower (Jacobsen Textron); the cutting unit was replaced by a roller with an aluminum cylinder 22 inches (56 cm) wide and 7.45 inches (19 cm) in diameter. The cylinder was drilled and tapped to accept 116 Black Widow golf shoe cleats (Softspikes LLC) (photo, above). The traffic simulator weighed approximately 253.5 pounds (115 kg) and produced compressive forces of 237 Newtons (front cylinder) and 328 Newtons (rear cylinder). Simulated traffic was applied across the seeding rate treatments three times weekly (four passes each time).
NDVI
The experimental plots were rated for normalized difference vegetation index (NDVI) (FieldScout TCM 500 NDVI Turf Color Meter, Spectrum Technologies) and shear vane (rooting and soil cohesion) strength (Turf-Tec Shear Strength Tester, Turf-Tec International).

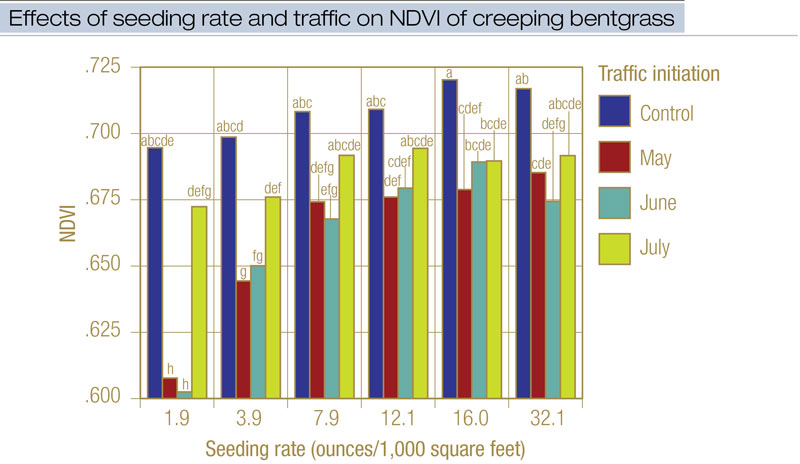
Figure 1. Effects of seeding rate and traffic initiation on normalized difference vegetation index (NDVI). V8 creeping bentgrass was seeded on Aug. 8, 2012, in East Lansing, Mich. Traffic treatments were four passes with a reel mower modified with plastic golf shoe cleats. NDVI ranges from 0.000 to 1.000, with higher values indicative of healthier plants. Columns with the same letter are not significantly different (p > 0.05).
NDVI is a good estimator of turf density, quality and vigor in response to traffic stress (9). When differences among seeding rate treatment levels were observed in 2013 and 2014, the mean NDVI values were not significantly different among seeding rates of 7.9 to 32.1 ounces/1,000 square feet at 44 to 51 weeks after seeding (Figure 1, above). A significant seeding rate × simulated traffic initiation interaction was also observed in 2013 at 49 weeks after seeding, and demonstrated that a combination of May and June traffic would decrease the NDVI values of creeping bentgrass seeded at or below 7.9 ounces/1,000 square feet when compared with the same grass seeded at 12.1 ounces/1,000 square feet that received only June traffic (Figure 1).
The results were obtained under optimal growing conditions for creeping bentgrass; throughout the duration of the study, summer temperatures did not exceed 90 F (32 C). Creeping bentgrass seeding rates from 12.1 to 32.1 ounces/1,000 square feet did not result in different NDVI responses at 47 weeks after seeding. The data suggest that, as turfgrass plants mature (43 weeks after seeding), the NDVI value of conservatively seeded (12.1 ounces/1,000 square feet) turfgrass stands will not diminish as late-spring play begins. The conservative seeding rate will not only expedite putting green establishment in the first year following renovation, but it will also save money if seed prices increase or stockpiles dwindle (1).
Shear vane strength and traffic

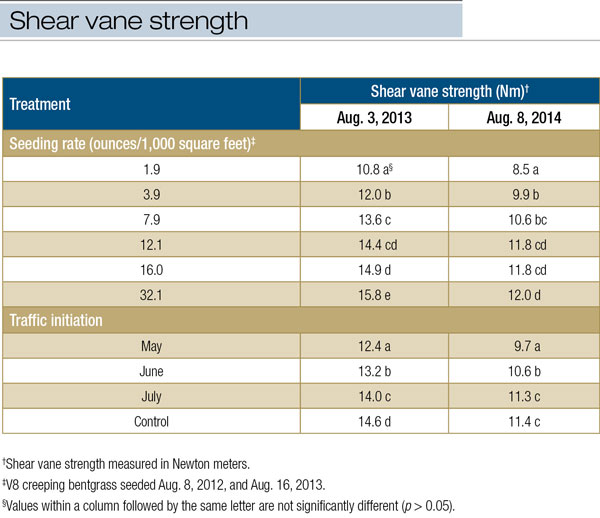
Table 1. Means of shear vane strength as affected by seeding rate (ounces/1,000 square feet) and traffic treatments (four passes with Jacobsen PGM 22 with 116 Black Widow Softspikes performed three times/week).
Shear vane strength is a proven method of quantitatively assessing turf stability (7). Seeding rate and traffic significantly affected the shear vane strength of creeping bentgrass at 51 weeks after seeding in 2013 and 2014 (Table 1, above). Differences among seeding rates were observed at seeding rates of 1.9 and 3.9 ounces/1,000 square feet. In 2013, the lower seeding rates produced the lowest mean shear vane strength, whereas the highest seeding rate of 32.1 ounces/1,000 square feet produced the highest mean shear vane strength. Statistically, no difference in mean shear vane strength was observed between seeding rates of 12.1 and 16.0 ounces/1,000 square feet in 2013. When differences among traffic treatments were observed, seeding rate treatments that received the July traffic had greater shear vane strength than those that received traffic in May and June.
In 2014, no significant difference in mean shear vane strength was observed among the seeding rates of 12.1, 16.0 and 32.1 ounces/1,000 square feet. Only May and June traffic were shown to reduce shear vane strength in comparison with the control and July traffic. These results show that a sustainable putting green surface can be achieved after renovation by seeding at the conservative rate of 12.1 ounces/1,000 square feet and then delaying play until late spring or early summer. As might be expected, the deleterious effects of traffic stress were not observed at the highest seeding rates.
Because the intensity of the establishment cultural practices (mowing, fertility and sand topdressing) was greater than in previous studies, plant growth characteristics were affected before trafficking took place. Although no observable traffic stress occurred in plots that received higher seeding rates, no real advantage was gained by using those rates. Seeding rates become more important as seed prices or quantities become suboptimal, because lost revenue is not an acceptable option for any golf course operation.
Conclusions
Careful analysis of the data showed that golf courses that partake in a renovation project can create a sustainable putting green surface by seeding at the conservative rate of 12.1 ounces/1,000 square feet. Although simulated traffic did not adversely affect the turfgrass plants, it is wise to delay play until late spring or early summer for best results. The conservative seeding rate will not only expedite putting green establishment in the first year after renovation, but it will also save money if seed prices rise or stockpiles dwindle.
Planning and timing are essential to the success of renovation projects. This research is meant to serve as a foundation for future research designed to explore turfgrass renovation practices related to cost-effective, sustainable turfgrass establishment.
Acknowledgments
The authors thank the Michigan Turfgrass Foundation for supporting this research.
Literature cited
- Dodson, K. 2016. Selecting sustainable turfgrass species: choosing a turf species for renovation or inter-seeding projects. Green Master 51(5):31-33.
- Glasgow, A. 2017. Not renovating; is It a possibility? New Zealand Turf Management Journal 34(2):6-7.
- Jiggens, M. 2016. Winter kill of greens provides perfect excuse for golf club to regrass via little used method. Turf and Recreation 29(3):6-12.
- Madison, J.H. 1966. Optimum rates of seeding turfgrasses. Agronomy Journal 58:441-443.
- Pavalko, R.S. 2016. Ground control: Navigating a renovation. Golf Course Management 84(9):68-76.
- Rabbit, A.E. 1950. Economics in turf maintenance through seed usage. Pages 45-49. In: Proceedings of National Turf Field Days, Oct. 15-17, 1950. Sponsored by U.S. Golf Association Green Section; USDA, Bureau of Plant Industry, Division of Forage Crops and Diseases; Mid-Atlantic Association of Greenkeepers. West Point Lawn Products, West Point, Pa.
- Rogers, J.N. III, and D.V. Waddington. 1993. Present status of quantification of sports turf surface characteristics in North America. International Turfgrass Research Journal 7:231-237.
- Torsiello, J. 2017. The way to go: Your greens need work, but does the project call for renovation or reconstruction? Golf Course Industry 29(5):26-34.
- Trenholm, L.E., R.R. Duncan and R.N. Carrow. 1999. Wear tolerance, shoot performance, and spectral reflectance of seashore paspalum and bermudagrass. Crop Science 39:1147-1152.
Thomas O. Green and Eric C. Chestnut are graduate students, and John N. Rogers III and James R. Crum are professors in the Department of Plant, Soil, and Microbial Sciences at Michigan State University, East Lansing, Mich.