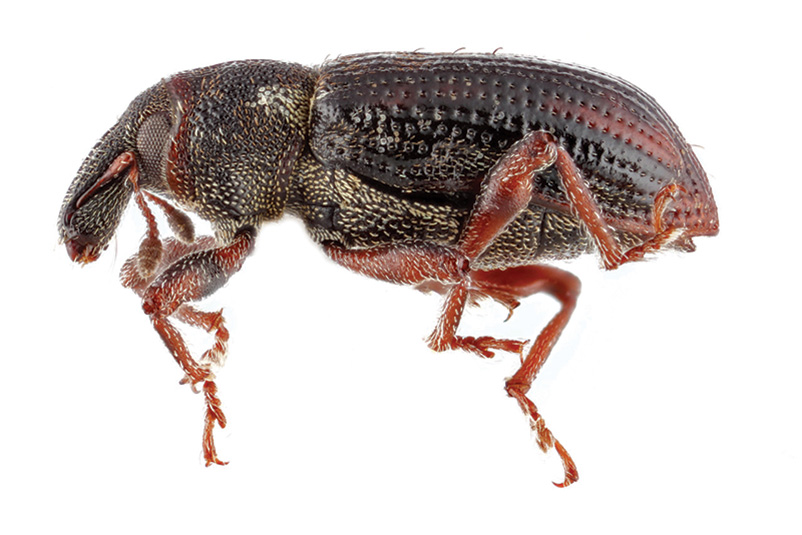
Figure 1. Annual bluegrass weevil (Listronotus maculicollis) adult. Photo by M. Bertone
The annual bluegrass weevil (Listronotus maculicollis; ABW) (Figure 1) is the most destructive insect pest of short-mown, cool-season turfgrasses on golf courses in the eastern U.S. ABW damages annual bluegrass (Poa annua) and creeping bentgrass (Agrostis stolonifera) by feeding on stems, crowns and leaf blades (5, 10). Effective management requires precise application timing windows, which are determined by a regimented sampling program to detect and track adults and larvae throughout the growing season. Although larval populations are less mobile and therefore easier to target with insecticides, they are difficult to find except in damaged turfgrass in North Carolina. Instead, adult ABW are monitored using weekly soap flushes (2 tablespoons dish detergent per gallon of water) applied to small (1.08-to-2.15-square feet/0.1-to-0.2-square meter) fixed areas with suspected ABW infestations. As the soap solution soaks through the soil profile, adults are forced to the surface, where they are collected and counted. Weekly counts are tracked to time adulticide applications, which are applied when adult activity reaches a “peak.” Larvicide application timing is then approximated based on adult activity (2).
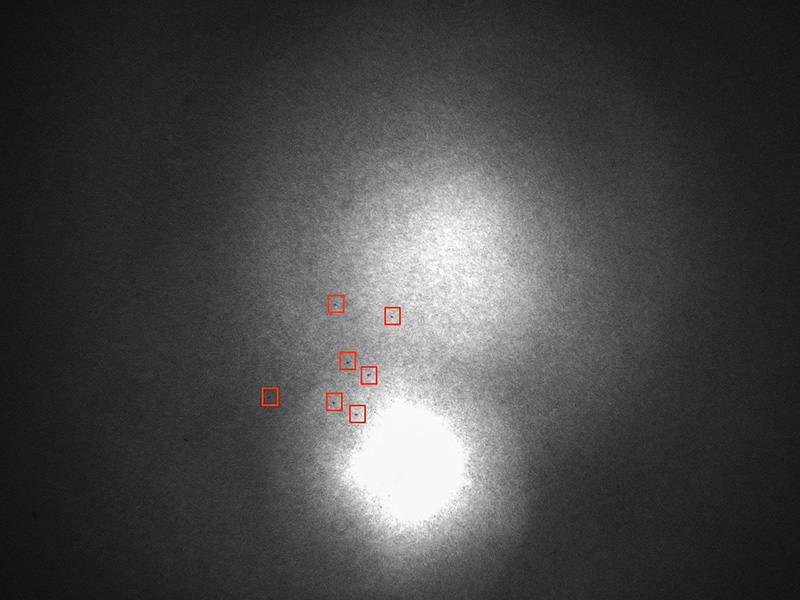
Figure 2. Annual bluegrass weevils on creeping bentgrass as imaged in the NIR spectrum using a DJI Mavic 3M.
While soap flushing can narrow application windows for ABW management, it has several limitations. To ensure recovery of active adult weevils, soap flushes often rely on biased sampling, focusing on areas of previous damage or infestation. This limits ABW sampling both in size and scope, potentially missing areas with large adult populations. Soap flushing is also laborious, as large volumes of solution are needed to penetrate the soil profile. Additionally, it can take adults several minutes to surface following application, particularly during colder weather. Sampling effort and time constraints ultimately reduce sampling area size resulting in limited knowledge of weevil distribution in the turfgrass stand. As a result, entire fairways are treated with insecticides when a targeted application in high-density areas (6, 7) would suffice. Conceptualizing new strategies for ABW monitoring could allow superintendents to sample larger areas with less effort that accurately reflect spatial distributions, improving ABW management approaches.
Recent advances in technologies such as unmanned aerial systems (UAS), computer vision and spectral imaging have shown potential for turfgrass pest management. UASs are currently utilized in other agricultural systems for mapping, pest scouting, pesticide applications and nutrient estimation (3). UASs can cover large areas easily with less labor required than traditional scouting methods. Computer vision technology analyzes images to identify, count and track objects of interest (9). Used with UASs, superintendents can scan for, detect and count insect pests on the turfgrass surface. Since ABW adults are nocturnal (2), spectral imaging is used to capture the light reflectance of each insect under an illumination system for detection. When imaged in the near infrared (NIR) spectrum, turfgrass vegetation reflects approximately 50% of NIR light (4), appearing in shades of gray, while black and brown beetles reflect little to no light, appearing black (8) (Figure 2).
Combining these technologies, we can rethink ABW monitoring and application strategies to determine weevil distribution within a much larger sampling area. The goal of this research was to develop and optimize an improved method for ABW adult scouting. Using this information, superintendents can pinpoint both exact timing and location to target ABW adults based on nocturnal activity.
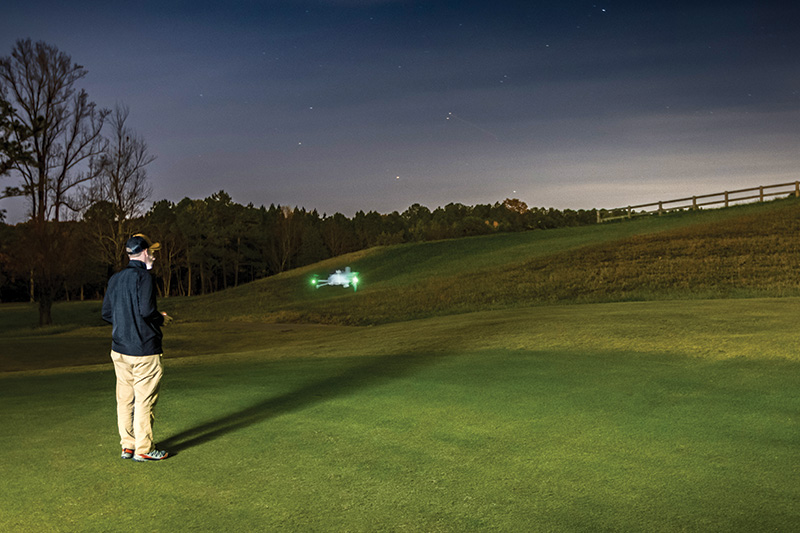
Figure 3. DJI Mavic 3M night flight for adult annual bluegrass weevils imaging. Photo by A. Sapp
Materials and methods
Dataset acquisition
NIR images of pinned ABW specimens were captured using a DJI Mavic 3M UAS flown approximately 3 feet (1 meter) above a creeping bentgrass stand (Figure 3). Imaging flights occurred on five separate nights, beginning approximately 30 minutes after sunset and lasting for one hour. The UAS was fitted with a custom NIR illuminator, consisting of 18 NIR LED bulbs soldered to a circuit board, to provide ample illumination of the imaged area in low light conditions. Field-collected adult ABW were pinned, with the pin entering ventrally through the center of the thorax without exiting the other side. The head of each pin was removed, allowing specimens to be positioned at natural heights in the turfgrass. The fifth imaging flight included pinned billbugs (Sphenophorus spp.), ground beetles (Carabidae) and click beetles (Elateridae) to account for other nocturnal insects that could appear during imaging. A total of 1,161 images were captured, with each covering approximately 5.4 square feet (0.5 square meter) in area and containing four to 15 pinned ABW specimens.
Prior to dataset annotation, images were preprocessed using OpenCV to increase the contrast between ABW and the background turfgrass. NIR images were annotated using X-AnyLabeling by drawing rectangular bounding boxes around each insect specimen and assigning the label “ABW” to each. The annotated dataset was tiled using Datumaro, splitting each image into 25 sub-images to prevent image resizing during model training. After image tiling, the dataset consisted of 29,025 annotated images randomly divided into training, testing and validation subsets using a 70/20/10 split for each imaging flight.
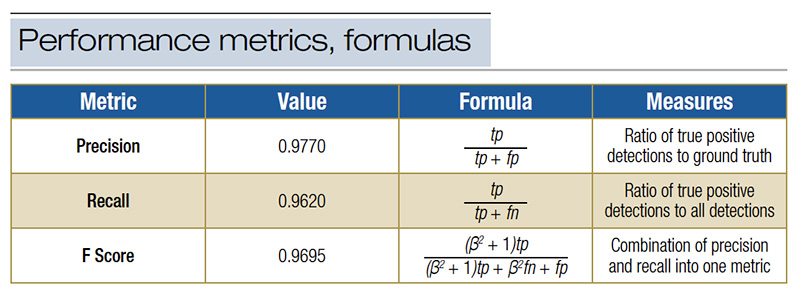
Table 1. Performance metrics and formulas used in model evaluation.
Model training
A YOLOv8s-p2 computer vision model was trained on the custom dataset to detect and count the number of adult ABW present in images. Training was conducted on a Linux desktop with 64gb of RAM and a NVIDIA RTX3060 GPU with 12gb of VRAM. The model was trained for 300 epochs using a batch size automatically calculated to optimize computer utilization. Dataset augmentations were applied during training to improve the robustness of the model. Confusion matrices were generated after training to report the number of true positive (tp) false positive (fp) and false negative (fn) detections on the testing data subset. Model performance was evaluated using precision, recall and F1 scores calculated from these values (Table 1). Precision assessed the proportion of correct predictions compared to the total number of predictions, while recall measured the proportion of correct detections to the true number of ABW present. The F1 score metric combines both precision and recall into a single statistic representing all predictions (true positive, false positive and false negative) compared to the true number of ABW present.
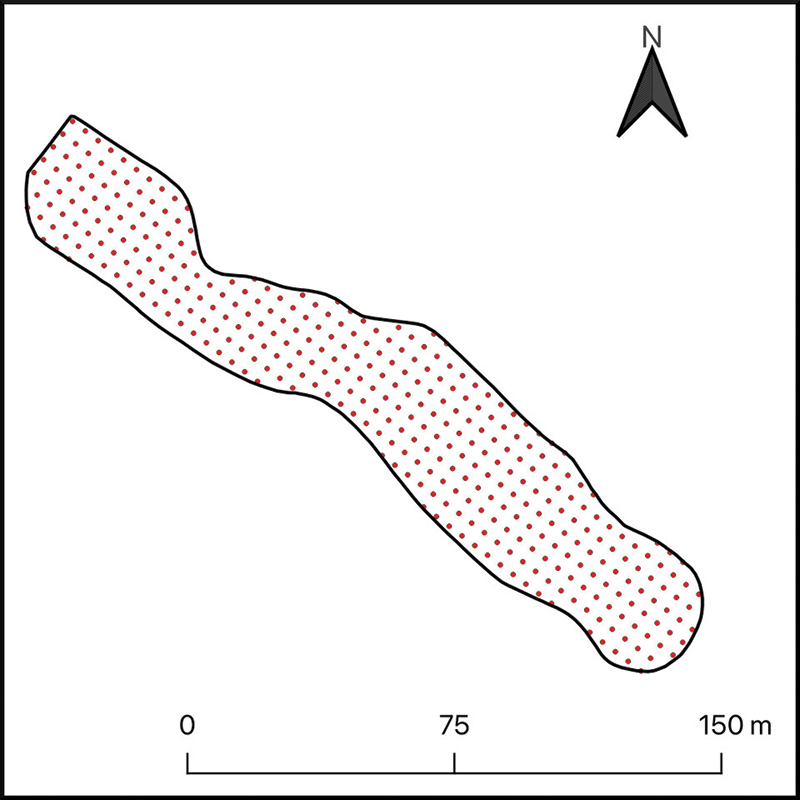
Figure 4. Imaging points on fairway for unmanned aerial system monitoring of adult annual bluegrass weevil populations.
Heatmap generation
Ten fairways from three golf courses in western North Carolina with established ABW populations were sampled using the modified UAS described earlier. A DJI RTK-2 base station was paired to the UAS to improve positional accuracy through the use of real time kinematic (RTK) positioning. Flights occurred during periods of ABW nocturnal activity, beginning no earlier than 9:54 p.m. EST and ending by 1:57 a.m. EST. Prior to flight missions, imaging points were established by creating a grid of marking flags with 14.76-foot (4.5-meter) spacing (Figure 4). The UAS was manually piloted from point to point, capturing images approximately 1 meter above the canopy with each marking flag centered along the top edge of each image. Images from each fairway were preprocessed in the same manner as images used to generate the annotated dataset. The coordinates for each image were extracted using ExifTool, and images were processed using the trained computer vision model. The model incorporated slicing aided hyper inference (1), allowing adult ABW to be detected and counted without the need to tile or resize images. Image names, coordinates and the number of adult ABW detected were recorded in files that were uploaded into QGIS. Heatmaps representing the distribution of ABW across each fairway were generated using the Heatmap (Kernel Density Estimation) tool (Figure 5).
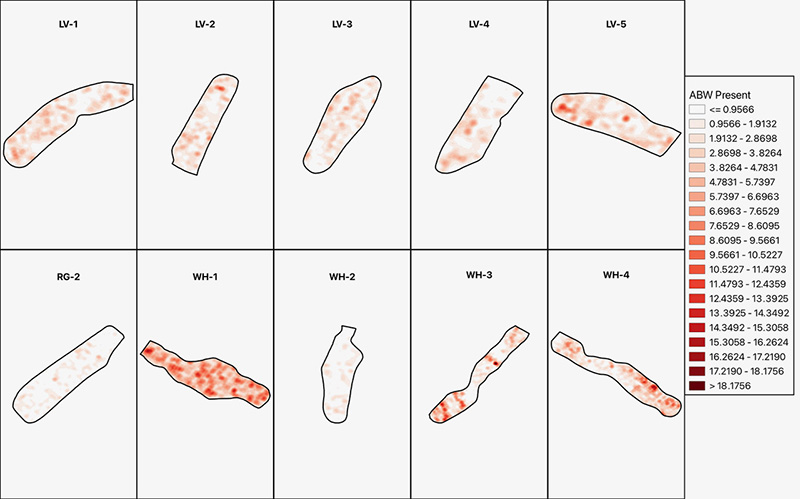
Figure 5. Heatmaps generated displaying adult annual bluegrass weevil density within fairways.
Results and discussion
The custom-trained computer vision model resulted in a precision of 0.9770, indicating that the model correctly detects ABW present with few false positive detections. Recall was 0.9620 for the validation subset, meaning few ABW present in images went undetected by the model. F1 scores, a metric that balances both precision and recall into one value, was 0.9695 (Table 1). This reflects a model that is balanced in precision and recall, minimizing both the number of false positive and false negative detections. When implemented for ABW management, high precision ensures that counts of adult ABW from each image are close to the true count in the field. Inflated adult ABW counts could potentially lead to unnecessary insecticide applications, increasing management cost. High recall ensures that any ABW present are actually detected by the model. This prevents infestation areas from going unreported, which may lead to damage if left untreated. With a high F1 score, precision and recall are balanced so that the detected number of adult ABW is close to the true number present while also ensuring that areas of infestation do not go unreported.
The 10 sampled fairways ranged in size from 29,977 to 78,803 square feet (2,785 to 7,321 square meters), with scouting flights lasting between 24 and 58 minutes (Table 2). Heatmaps displaying the spatial distribution of adult ABW populations were generated using image coordinates and adult ABW detections (Figure 5). Heatmaps provide a visual representation of ABW distribution within fairways by estimating adult counts between counts from imaging points. The heatmaps generated from this research display uneven spatial distributions of adult ABW populations across fairways, confirming findings from previous research (6, 7). By visualizing the population distribution and “hot spots” of activity, superintendents have the option to make targeted ABW applications, lowering management cost.
This work utilizes a new computer vision model that was developed to accurately detect and count the number of adult ABW present in a sampled area. Integrating the model into a UAS-based fairway scanning program can determine the spatial distribution of adult ABW populations in a sampled area. This monitoring improvement not only covers a larger area than traditional sampling methods, but also significantly improves sampling time efficiency. Heatmaps generated through UAS scouting clearly highlight areas of high weevil density and highlight opportunities for targeted applications. Monitoring adult ABW using this technology may also be implemented in future research to examine factors influencing population distributions, nocturnal activity and other behaviors. This method can also be adapted to scout for other surface-active nocturnal turfgrass insects, such as billbugs (Sphenophorus spp.). This research is one of many emerging technologies that seek to improve turfgrass management by increasing scope and performance while reducing economic costs.
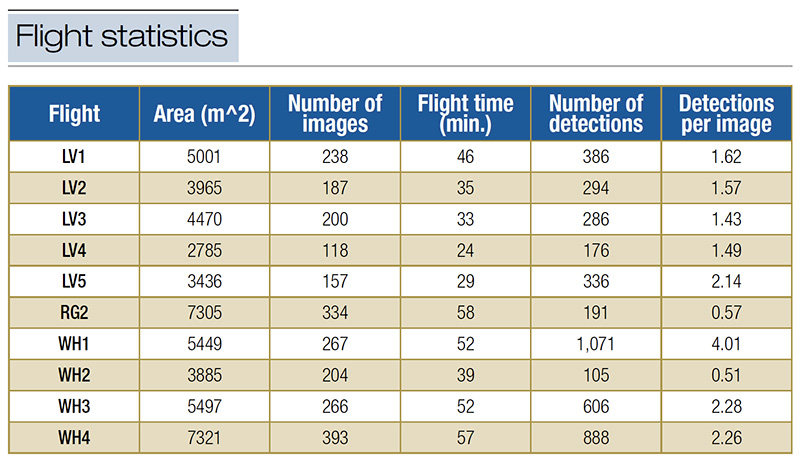
Table 2. Fairway sampling flight statistics including area covered (m2), number of images, time of flight, number of ABW detected and average detections per image.
The research says
- This work utilizes a new computer vision model that was developed to accurately detect and count the number of adult ABW present in a sampled area.
- This monitoring improvement not only covers a larger area than traditional sampling methods, but also significantly improves sampling time efficiency.
- Heatmaps generated through UAS scouting clearly highlight areas of high weevil density and highlight opportunities for targeted applications.
- This method can also be adapted to scout for other surface-active nocturnal turfgrass insects, such as billbugs (Sphenophorus spp.).
Literature cited
- Akyon, F.C., S.O. Altinuc and A. Temizel. 2022. Slicing aided hyper inference and fine-tuning for small object detection. Pages 966-970. In: 2022 IEEE International Conference on Image Processing (ICIP) (https://doi.org/10.1109/ICIP46576.2022.9897990).
- Vittum, P.J. 2020. Coleopteran Pests: Family Curculionidae. Pages 267-298. In: Turfgrass Insects of the United States and Canada. Cornell University Press (https://doi.org/10.7591/cornell/9781501747953.003.0018).
- McGraw, B.A., and A.M. Koppenhöfer. 2008. Biology and management of the annual bluegrass weevil, Listronotus maculicollis (Coleoptera: Curculionidae). Pages 335-350. In: Handbook of turfgrass management and physiology. CRC Press (https://search.ebscohost.com/login.aspx?direct=true&db=nlebk&AN=201846&site=ehost-live&scope=site).
- Billeisen, T. 2025. Annual Bluegrass Weevil. North Carolina State University Extension (https://turf.ces.ncsu.edu/insects/annual-bluegrass-weevil-in-turf/).
- McGraw, B.A., and A.M. Koppenhöfer. 2015. Spatial analysis of Listronotus maculicollis immature stages demonstrates strong associations with conspecifics and turfgrass damage but not with optimal hosts on golf course fairways. Entomolologia Experimentalis et Applicata 157:307-316 (https://doi.org/10.1111/eea.12363).
- McGraw, B.A., and A.M. Koppenhöfer. 2010. Spatial distribution of colonizing Listronotus maculicollis populations: implications for targeted management and host preference. Journal of Applied Entomology 134:275-284 (https://doi.org/10.1111/j.1439-0418.2009.01476.x).
- Hassler, S.C., and F. Baysal-Gurel. 2019. Unmanned aircraft system (UAS) technology and applications in agriculture. Agronomy 9:618 (https://doi.org/10.3390/agronomy9100618).
- Tian, H., T. Wang, Y. Liu, et al. 2020. Computer vision technology in agricultural automation — A review. Information Processing in Agriculture 7:1-19 (https://doi.org/10.1016/j.inpa.2019.09.006.)
- Knipling, E.B. 1970. Physical and physiological basis for the reflectance of visible and near-infrared radiation from vegetation. Remote Sensing of Environment 1:155-159 https://doi.org/10.1016/S0034-4257(70)80021-9.
- Mielewczik, M., F. Liebisch, A. Walter, et al. 2012. Near-infrared (NIR)-reflectance in insects — Phenetic studies of 181 species. Entomologie Heute 24:183-215.
Gram Grant (gmgrant2@ncsu.edu) is a graduate student and Terri Billeisen is director of undergraduate programs, adjunct assistant professor, AGI coordinator and Extension associate in the Department of Entomology and Plant Pathology at North Carolina State University, Raleigh.