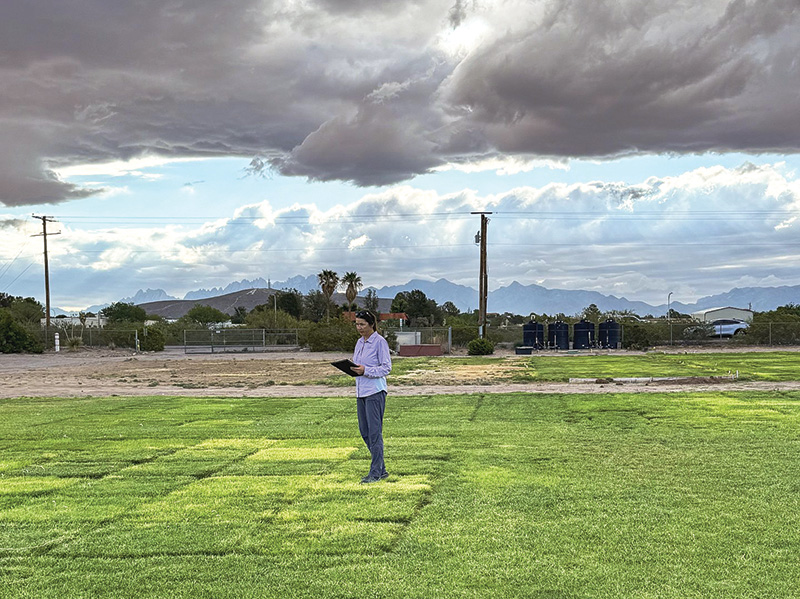
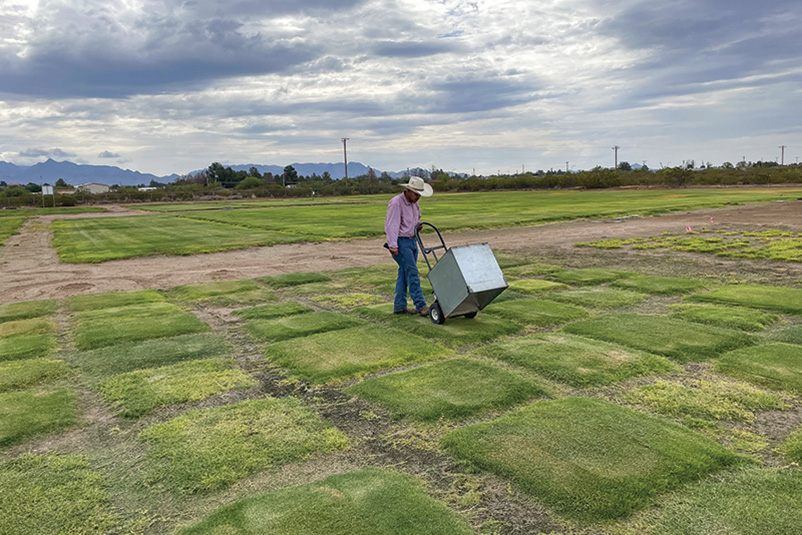
Elena Sevostianova evaluates a research plot at New Mexico State University. Photos courtesy of Elena Sevostianova
In the southwestern United States, outdoor irrigation accounts for roughly 60%-70% of residential summer water use, largely because natural precipitation falls far short of plant water demand driven by evapotranspiration (ET) (4). In arid regions such as southern New Mexico, annual ET can exceed 63 inches (1,600 millimeters), while long-term average precipitation is less than 7 inches (180 millimeters). As a result, maintaining turfgrass areas requires substantial supplemental irrigation.
To conserve water, municipalities increasingly encourage the use of drought-tolerant turf species and cultivars capable of maintaining acceptable quality under reduced irrigation. Evapotranspiration is a function of climate (temperature, solar radiation, humidity and wind speed). Climate data can be used to calculate ET for certain crops or reference evapotranspiration (ETref or ET0). Most recently, a standardized ETref has been introduced that is used to adjust ETref for short grass (i.e. turfgrass that is maintained at 4.7 inches/12 centimeters), which then is referred to as ETOS (1). When measured ET (e.g. by means of weighing lysimeters) is compared to a climate-based ETref, the derived ratio (ET/ETref) is defined as the crop coefficient (Kc). Lower Kc values indicate lower water demand. Numerous Kc values were determined for both warm-season (WS) and cool-season (CS) turfgrasses, with reviews provided by Romero and Dukes (8) and Braun et al. (3).
In general, WS turfgrasses have lower Kc values than CS grasses, particularly under deficit irrigation (or irrigation below a certain modeled ET) reflecting better tolerance of high temperatures and greater drought resistance. Crop coefficients are not fixed values. They vary with species, cultivar, mowing height, season and local climate. Environmental conditions often have a greater influence on turf water use than genetics alone, which explains why turf performance under deficit irrigation can differ widely between locations. This variability highlights the importance of conducting regional field trials to determine realistic irrigation thresholds and recovery potential for different turfgrasses (10).
While numerous studies have documented differences in water requirements among turf species, less information is available on how different grasses recover after prolonged drought stress, particularly under arid conditions. At the same time, advances in turfgrass breeding have produced new cultivars marketed as drought tolerant, yet independent data on their actual irrigation requirements and recovery ability remain limited.
To address these gaps, a three-year field study was conducted at New Mexico State University to evaluate the performance and recovery of commonly used CS and WS turfgrasses irrigated at varying percentages of reference evapotranspiration. The objectives were to identify irrigation levels that maintain acceptable turf quality and to compare species and cultivars for drought tolerance and recuperative potential under chronic water stress.
Turf performance was evaluated every two weeks during the growing season. Visual turf quality was rated on a 1-to-9 scale, with a rating of 6 considered minimally acceptable. Percent green cover was measured using digital image analysis under standardized lighting conditions.
Materials and methods
Field research was conducted from 2013 to 2015 at the New Mexico State University Turfgrass Research Center in Las Cruces, N.M., an arid location in USDA Plant Hardiness Zone 8 at an elevation of 4,150 feet (1,265 meters). The site experiences high evaporative demand and limited precipitation, making it well suited for evaluating turfgrass performance under reduced irrigation. The soil at the site consisted of a sandy loam with a pH of 8.2.
Three years of field research evaluated green cover and visual quality of three CS species: Kentucky bluegrass (KB) (Poa pratensis L.) (four cultivars); tall fescue (TF) (Schedonorus arundinaceus (Schreb.) (three cultivars); and perennial ryegrass (PR) (Lolium perenne L.) (three cultivars); and two WS turfgrasses: bermudagrass (BE) (Cynodon dactylon L.) (three cultivars) and buffalograss (BU) (Buchloe dactyloides (two cultivars). Cool-season grasses were seeded in September of 2012 and WS grasses in April of 2013. Kentucky bluegrass included three cultivars, namely, Barduke, Barserati, Thermal Blue and one blend KB-Pennington Smart Seed (Ridgeline 43.6%, Wildhorse 39.1%, Mallard 14.1%). Tall fescue cultivars were BarRobusto, Barvado and one blend TF-Pennington Smart Seed (Virtue II 44.6%, Penn RK4 29.7%, Justice 23.9%). Perennial ryegrass cultivars were Pinnacle III and Premier III and one blend PR-Pennington Smart Seed (1G Squared 34.3%, Integra II 34%, APR 2105 29.1%). Bermudagrass cultivars were Princess 77, Yukon and C291, and buffalograss cultivars were SWI 2000 and an unnamed experimental cultivar. All grasses were maintained at a height of 2 inches (5 centimeters) and managed using standard fertility and weed- and insect-control practices typical of golf course maintenance.
Irrigation was applied using an in-ground sprinkler system and scheduled daily based on reference evapotranspiration for short grass (ETos). Five irrigation treatments were imposed, which included significant deficit irrigation levels: 115%, 100%, 85%, 70% and 55% of ETos. Irrigation amounts were recalculated weekly using local weather data. System uniformity was verified through routine irrigation audits, and irrigation was suspended following significant rainfall events.
Turf performance was evaluated every two weeks during the growing season. Visual turf quality was rated on a 1-to-9 scale, with a rating of 6 considered minimally acceptable. Percent green cover was measured using digital image analysis under standardized lighting conditions. Data were summarized by season and year to evaluate both summer performance and fall recovery following drought stress.
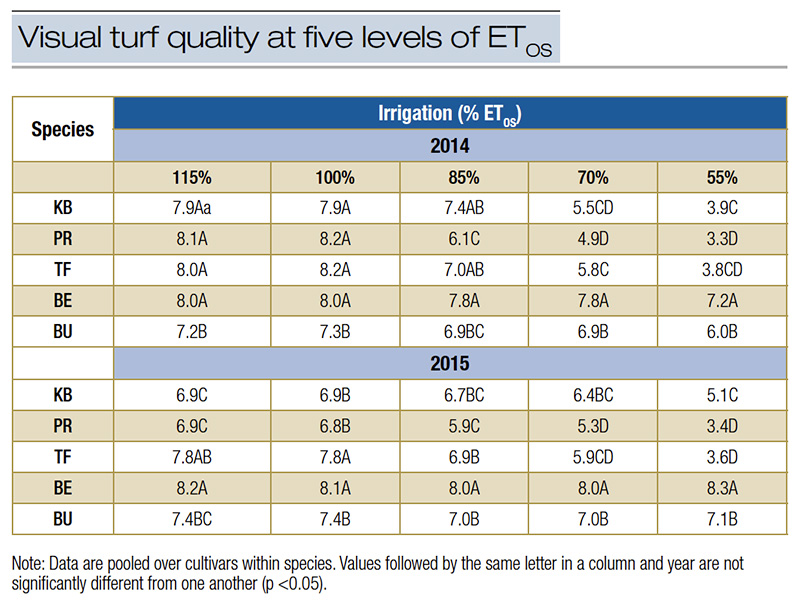
Table 1. Visual turf quality (taken on a scale from 1 to 9; with 1 = poor quality, dead grass, ≥6 = minimum acceptable and 9 = excellent) of cool-season (CS) species Kentucky bluegrass (KB) (Poa pratensis L.), perennial ryegrass (PR) (Lolium perenne L.) and tall fescue (TF) [Schedonorus arundinaceus (Schreb.) Dumort.] and for warm-season (WS) (Cynodon dactylon L.) species bermudagrass (BE) and buffalograss (BU) [Buchloe dactyloides (Nutt.) Englem] irrigated at five levels of ETOS during summer of 2014 and 2015. Data are pooled over cultivars within species.
Results
Summer turfgrass quality and cover
During the first summer of the study (2013), no differences in turf quality or percent green cover were detected among irrigation treatments. Above-average summer precipitation minimized drought stress, resulting in similar performance across all irrigation levels. However, differences among grass types were evident, with CS grasses exhibiting higher quality than WS grasses due to earlier establishment and to genetically darker green color.
In contrast, clear irrigation effects emerged in the summers of 2014 and 2015. Cool-season grasses showed significant declines in visual quality as irrigation was reduced. When irrigation fell below 85% ETos, all CS species experienced unacceptable quality in at least one year. Perennial ryegrass was the most sensitive, followed by TF, while KB demonstrated slightly greater tolerance and maintained acceptable quality at 70% ETos in 2015 (Table 1).
Warm-season grasses were substantially more drought-tolerant. Bermudagrass consistently maintained acceptable or better quality across all irrigation levels in both years, including at 55% ETos. Buffalograss also maintained acceptable quality at reduced irrigation levels but generally ranked lower than BE (Table 1).
Percent green cover followed similar trends. In 2014 and 2015, irrigation level significantly affected cover in CS grasses, while WS grasses showed little to no reduction at lower irrigation rates. Bermudagrass maintained the highest cover at the lowest irrigation levels. Among cultivars, KB Barserati consistently ranked among the top performers for both quality and cover, highlighting the importance of cultivar selection under deficit irrigation.
Fall turfgrass quality and cover
Fall ratings were used to evaluate how well turf recovered after summer deficit irrigation. Overall, fall response depended on year, species and (in some cases) cultivar, with irrigation effects becoming more pronounced in 2014 and 2015.
Fall 2013
Similar to summer 2013, treatment differences were limited, reflecting relatively favorable conditions. When data were pooled by species, visual quality remained acceptable for most CS grasses across irrigation levels, with the main exception being PR, which dropped below acceptable quality at 55% ETos (Table 2).
Warm-season grasses showed lower fall quality than CS species at every irrigation level, consistent with seasonal decline as temperatures dropped. Percent green cover followed the same general pattern: CS grasses maintained high cover, while WS grasses had lower fall cover overall.
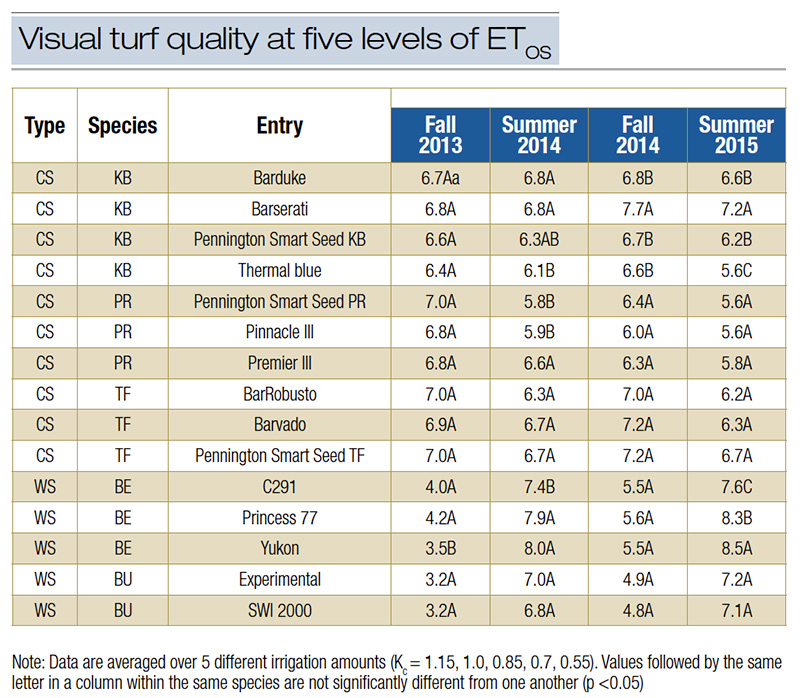
Table 2. Visual turf quality (taken on a scale from 1 to 9; with 1 = poor quality, dead grass ≥6 = minimum acceptable, and 9 = excellent) of cool-season (CS) species Kentucky bluegrass (KB) (Poa pratensis L.), perennial ryegrass (PR) (Lolium perenne L.) and tall fescue (TF) [Schedonorus arundinaceus (Schreb.) Dumort.] and for warm-season (WS) (Cynodon dactylon L.) species bermudagrass (BE) and buffalograss (BU) [Buchloe dactyloides (Nutt.) Englem] irrigated at five levels of ETOS during fall of 2013 and 2014 and summer 2014 and 2015.
Fall 2014
Cool-season turf showed clear recovery compared with summer performance. When averaged across irrigation levels, most CS cultivars improved in fall quality, indicating recuperative potential once peak summer stress passed. When analyzed by irrigation level, KB and TF generally maintained acceptable fall quality at 70% ETos, demonstrating that some CS species can rebound under moderate deficit irrigation. In contrast, WS species declined in fall quality compared with summer at all irrigation levels, and no single irrigation “threshold” explained the decline — suggesting that seasonal dormancy effects outweighed irrigation level (Table 2). For green cover, cultivar differences were evident. KB Barserati was notably stable and did not show a decline in cover across irrigation levels, while several other cultivars and both WS species showed reduced cover beginning around 85% ETos.
Fall 2015
Both irrigation level and cultivar influenced fall performance. Kentucky bluegrass quality typically declined only at 55% ETos (with Barduke showing a decline at 70% ETos), and Barserati again ranked among the best performers across irrigation levels. In TF, the Pennington Smart Seed blend performed especially well during recovery, maintaining relatively strong quality at 70% and 55% ETos. Among WS grasses, BE cultivar responses shifted from summer to fall: Yukon performed well in summer but showed comparatively lower fall quality and the lowest cover among BE entries at most irrigation levels. Across all CS entries, Barserati was the only cultivar that maintained percent green cover at 55% ETos.
Discussion
Water shortages across the desert Southwest continue to drive demand for turfgrass cultivars that maintain acceptable performance with less irrigation (6). Deficit irrigation and drought-tolerant turf selection are well-established strategies, but performance benchmarks must be updated as new cultivars are released and tested under field conditions (9).
Year 1 results (2013) were strongly influenced by establishment timing. Cool-season grasses were seeded in fall 2012 and had a head start, while WS grasses were seeded in spring 2013. This difference likely contributed to lower WS quality and cover early in the project, while the strong summer performance of PR reflected its rapid establishment.
By 2014 and 2015, WS grasses consistently outperformed CS grasses under reduced irrigation, aligning with previous research showing WS turf generally maintains higher quality under drought stress than CS turf (5, 7). Bermudagrass was the most drought tolerant species in this trial. In 2014, BE only showed reduced quality at the lowest irrigation level (55% ETos), and in 2015 BE maintained acceptable quality even at the lowest replacement rate. These results support past findings that BE can remain acceptable under moderate deficit irrigation (2). Among BE cultivars, Princess 77 and Yukon performed best during summer, although Yukon declined earlier in fall than the other BE entries — an important consideration in transition-zone climates where seasonal decline can affect late-season expectations.
Buffalograss maintained acceptable quality at the lowest irrigation levels but generally had lower quality than BE under higher irrigation. BU’s gray-green color can make drought symptoms less visually obvious, which may contribute to its perceived competitiveness at low irrigation, even if aesthetic preference favors greener turf under full irrigation. Both WS species declined in fall as dormancy approached, with BU showing a faster drop in quality and SWI 2000 performing poorest in fall 2015.
Cool-season grasses showed greater sensitivity to deficit irrigation and more variability among cultivars. Perennial ryegrass had the sharpest decline in quality under reduced irrigation, consistent with its known limitations under heat and drought. Tall fescue and KB performed better than PR overall, but their thresholds differed from some published studies, underscoring the influence of climate, cultivar and trial conditions on drought outcomes. Importantly, KB cultivars Barserati and Barduke maintained green cover across irrigation levels, and Barserati repeatedly ranked among the top performers in both summer and fall, indicating strong drought resilience and recovery potential.
Overall, these findings reinforce three practical points for water-limited turf management: (1) WS grasses — especially bermudagrass — offer substantial water-saving potential in arid and transition environments; (2) cultivar selection within a species can be as important as species choice; and (3) recovery performance should be evaluated alongside drought tolerance, because seasonal rebound can help managers strategically reduce irrigation during peak stress while maintaining acceptable turf over the full season.
The research says
- Warm-season grasses — especially bermudagrass — offer water-saving potential in arid and transition environments during summer but come with reduced quality during spring and late fall due to dormancy.
- Cultivar selection within a species can be as important as species choice.
- Recovery performance should be evaluated alongside drought tolerance, because seasonal rebound can help managers strategically reduce irrigation during peak stress while maintaining acceptable turf over the full season.
Acknowledgments
Financial support of the study was provided by Barenbrug Co. The authors are also grateful for the donations from Helena Chemical Company.
Literature cited
- Allen, R.G., I.A. Walter, R.L. Elliott, T.A. Howell, D. Itenfisu, M.E. Jensen and R.L. Snyder. 2005. The ASCE standardized reference evapotranspiration equation. American Society of Civil Engineers, Reston, Va.
- Bañuelos, J.B., J.L. Walworth, P.W. Brown and D.M. Kopec. 2011. Deficit Irrigation of seashore paspalum and bermudagrass. Agronomy Journal 103(6):1567-1577 (https://doi.org/10.2134/agronj2011.0127).
- Braun, R.C., D.J. Bremer, J.S. Ebdon, J.D. Fry and A.J. Patton. 2022. Review of cool-season turfgrass water use and requirements: I. Evapotranspiration and responses to deficit irrigation. Crop Science 62:1661-1684 (https//doi: 10.1002/csc2.20791).
- Devitt, D.A., and R. Morris. 2010. Sustainable water use in urban landscapes in the 21st century: A Las Vegas perspective. Acta Horticulturae 881:483-486 (https://doi.org/10.17660/ActaHortic.2010.881.77).
- Huang, B. 2008. Turfgrass water requirements and factors affecting water usage. Water quality and quantity issues for turfgrasses in urban landscapes. 193-203.
- Leinauer, B., and D.A. Devitt. 2013. Irrigation science and technology. Pages 1075-1131. In Turfgrass: Biology, use, and management, Vol. 56. American Society of Agronomy, Crop Science Society of America, Soil Science Society of America. (https://doi.org/10.2134/agronmonogr56.c28).
- Meyer, J.L., and V.A. Gibeault. 1986. Turfgrass performance under reduced irrigation. California Agriculture. August:19-20.
- Romero, C.C., and M.D. Dukes. 2016. Review of turfgrass evapotranspiration and crop coefficients. Transactions of the ASABE 59(1):207-223. (https://doi.org/10.13031/trans.59.11180).
- Sandor, D., D. Karcher, M. Richardson, D. Hignight and K. Hignight. 2019. Kentucky bluegrass performance under chronic drought stress. Crop, Forage & Turfgrass Management 5(1):180089 (https://doi.org/10.2134/cftm2018.10.0089).
- Sevostianova, E., D. VanLeeuwen, M. Serena, R. Sallenave and B. Leinauer. 2024. Performance and recovery of turfgrasses irrigated with varying crop coefficients. Crop Science (https://doi.org/10.1002/csc2.21433).
Elena Sevostianova (esevosti@nmsu.edu) is a senior research scientist in the Department of Plant and Environmental Sciences; Dawn VanLeeuwen is a professor in the Department of Economics, Applied Statistics, and International Business; Rossana Sallenave is the Extension Aquatic Ecology Specialist in the Department of Extension Animal Sciences & Natural Resources; and Bernd Leinauer is a Regents Professor in Extension Plant Sciences Department, all at New Mexico State University, Las Cruces. Matteo Serena is the senior manager, Irrigation Research and Services, at USGA’s Green Section.